Rollover Days
Rollover Days and Volume
Rollover day is when we switch from trading the contract that will expire this quarter to the contract that will expire the following quarter.
The futures contract that we focus on (the e-mini S&P500 or ES) expires on the third Friday of the months of March (H), June (M), September (U) and December (Z). The rollover days, however, are 8 days before expiration on the second Thursday of each of these months. These months have the letter designations H, M, U, and Z. Depending on the charting and trading platform that you're using you would usually have to switch your reference to the following month by letting the software know the contract and expiry month/year. On eSignal "ES H5" refers to the e-mini S&P contract that expires on the third Friday March 2005. Using eSignal and the #F designation it will switch to the new contract on the rollover day for you.
I have bit more to explain about how eSignal uses the #F designation to make rollover day easier for you. On Globex, the trading day starts at 16:30 EST the evening before the "day" and ends at 16:15 EST on the "day." So, for example, Thursday's trading session starts at 16:30 EST on Wednesday and ends at 16:15 EST on Thursday. If you have a chart that is plotting the symbol ES #F, then this chart will switch the symbol that is being plotted at the start of the Rollover Day which in this case is actually 16:30 EST before the "day" which in our case is the second Thursday in each quarter. So the symbol swap happens at 16:30 EST on the Wednesday before that Thursday.
Why is this useful? If you have 15 charts that plot several E-mini contracts on several timeframes then you have to manually edit each chart and change the symbol from the current to the next quarter. If you've specified #F then this will happen automatically for you and save you from forgetting or missing a chart - especially if you have multiple pages/layouts of charts that you load.
When to switch contracts
When and why you should switch from trading one contract to the next?
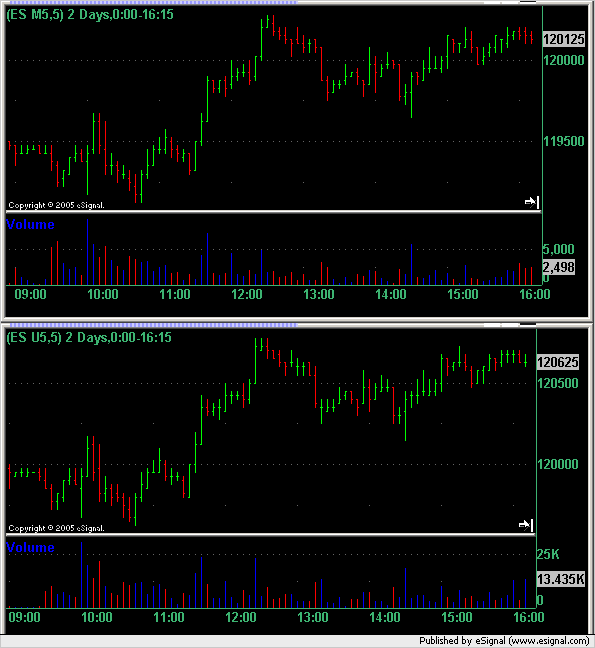
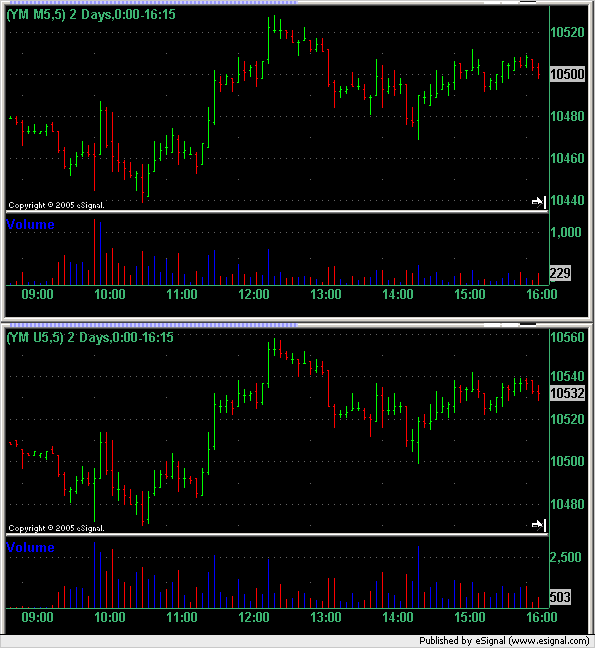
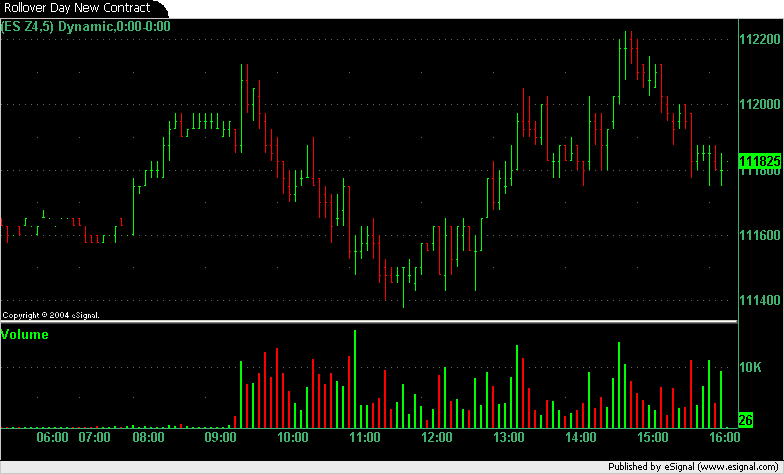
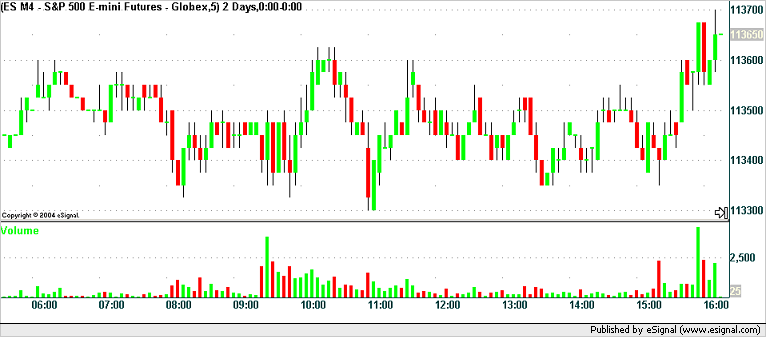
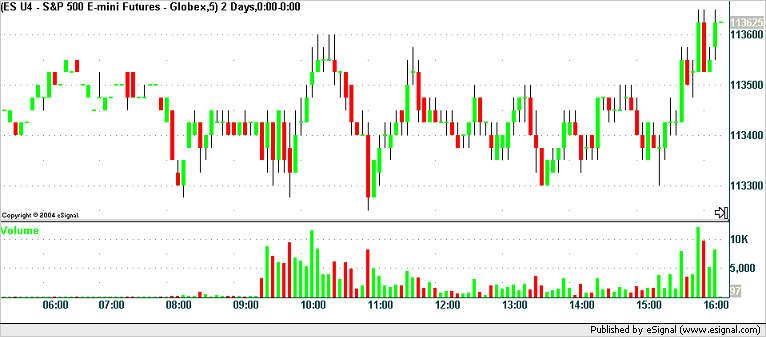
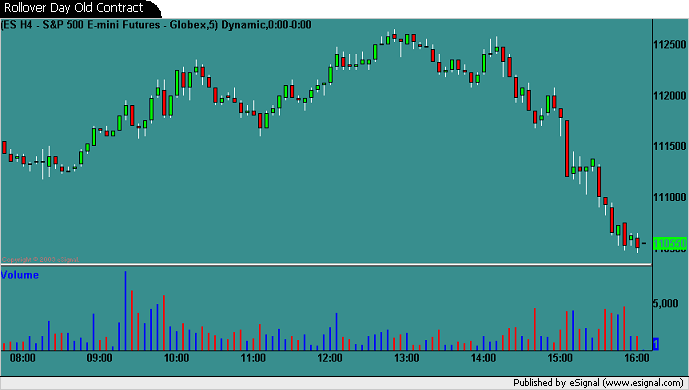
Liquidity switches from the current contract to the next contract at 09:30 EST on rollover day. This can be seen by comparing the volume (number of contracts traded) in the old and new contracts in the charts below. [Note that the scale on the volume part of the charts is different for the near and far expiry months because of the rollover effect and traders switching to the far contract.]
If you are opening a new position in the ES before 09:30 that you plan to close during the day or perhaps before 09:30 you could use the near contract but you must remember that the spread will start widening as traders start switching out of this contract and you will struggle to get as favorable a price as you would with the next contract.
The general rule here is that you want to get into the next contract as liquidity moves from one to the other. At this point in time (09:30 EST on rollover day) the spreads will be tightest and you will lose the least amount on the spread as you switch contracts. This is especially important for swing and longer term traders that may want to carry their positions past the expiry date.
If you are opening a new position that you intend to carry for more than an hour and it's 09:00 EST on rollover day then you are better off trading the next (new) contract.
What else happens on rollover day?
You may hear plenty of myths and "truths" about rollover and expiry days. Don't believe any of it until you have seen it several times or have back tested this and verified it. I have heard many traders say: "They always mark it up on rollover day" or "stay away from rollover day because it is choppy and impossible to trade."
First of all do your own back testing and investigations before you believe any of this. Start off by looking at the charts on this page and see if any of them (all from rollover days) match what you have heard. Then get some data from previous rollover days and see what happen on those days. Even daily data will allow you to compute the change from open to close or from previous close to rollover day close.
There is no reason for the market to act any differently on rollover days. Scalpers, day traders, swing traders and longer term investors balance each other out. Traders trading large size contracts know that they risk moving the market if they are rolling from one contract to the other and so they break their positions up into more manageable sizes and move their contracts in partials in order to get the best execution prices. Traders are not focusing on the rollover process but instead on strategies that will make them money. They want to move to the next contract at the best possible prices and lowest possible costs. The rollover process is merely a mechanical necessity of the market.
There are (allegedly) pit traders that just specialize in the days around rollover. They only trade these days (I have no idea what they do for the other 10 weeks in between rollovers but this is what I've been told) and they trade the widening spread in the expiring contracts. For whatever reason there are longer term traders that don't close out and roll their contracts at the optimum time. These rollover "specialists" will make a market (at a wider than normal spread) in the expiring contract and (apparently) make a very good living out of the rollover process.
We have stopped updating the charts on these web pages as they repeat themselves from contract to contract and there is enough information here to educate you and convince you when the best time to switch contracts is.
Rollover Day Charts
9 June 2005 - ES Chart
YM Chart for same period
Rollover Day Charts
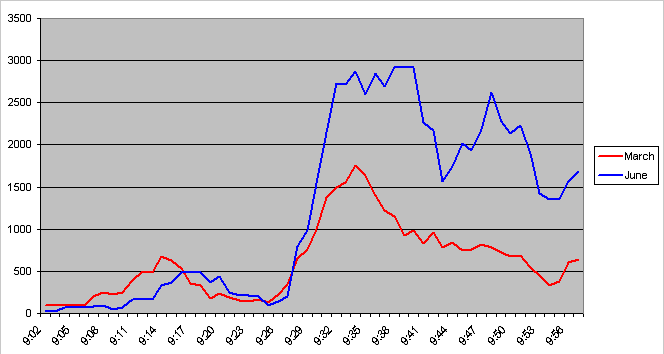
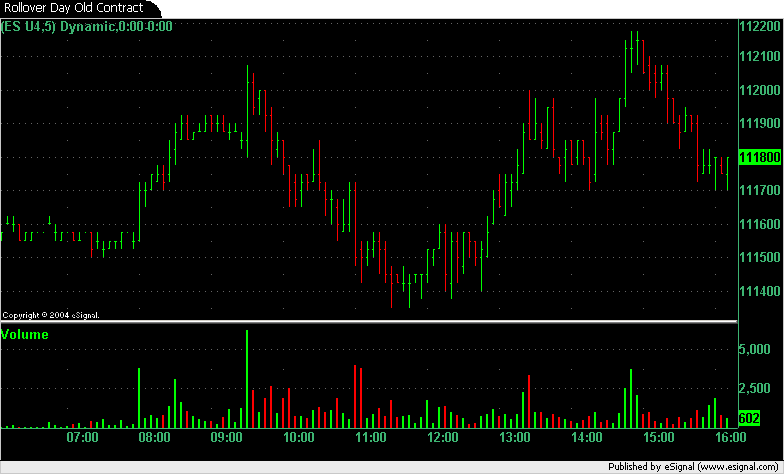
10 March 2005
When does volume switch from one contract to another? The chart below shows the volume for the March and June 2005 contracts for the E-mini S&P500 between 09:00 and 10:00 EST. The volume for the old contract ( March ) dominates in the first 15 minutes and then again just before the open at 09:30 EST. Otherwise you can see that the volume in the new contract ( June ) have taken over. (The chart shows the 5 minute average volume for each minute. e.g. The volume on the 09:17 bar shows the average volume per minute from 09:15 to 09:19 inclusive.)
Rollover Day Charts (continued)
Charts showing previous rollover day volume changes:
9 December 2004
Rollover Day Charts (continued)
9 September 2004
Rollover Day Charts (continued)
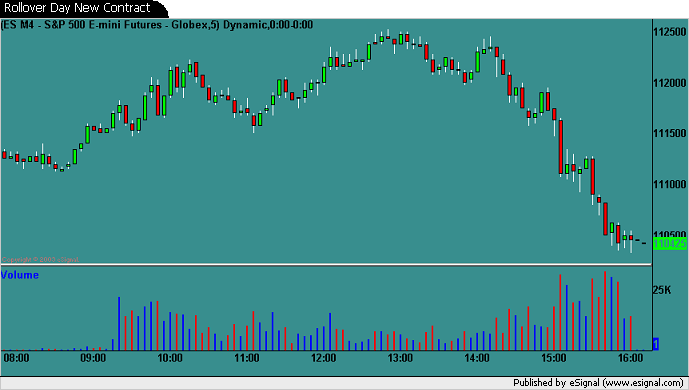
10 June 2004
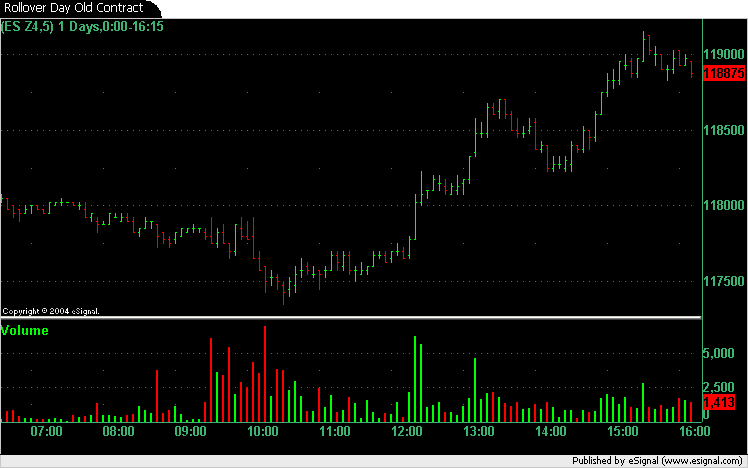
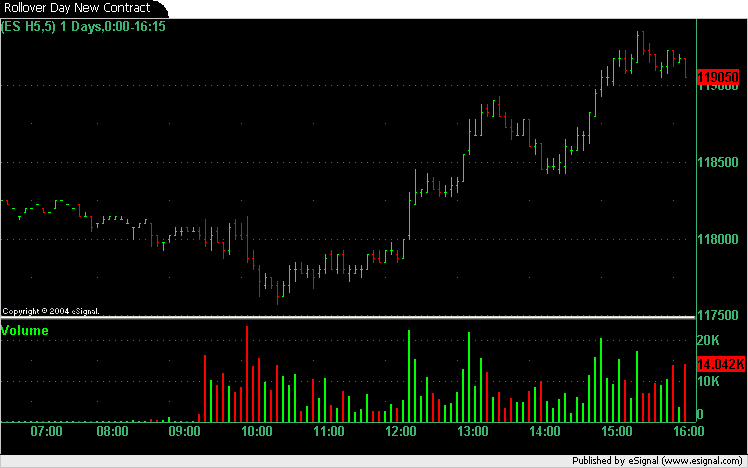
Here is the following contract rollover day for your comparison. Note that until shortly after 09:00 EST the June contract sees slightly more activity (as measured by volume) than the September contract but after that the September contract is the lead contract.
June 2004 Contract (Old) - 5 minute chart on 10 June 2004
September 2004 Contract (New) - 5 minute chart on 10 June
2004
Rollover Day Charts (continued)
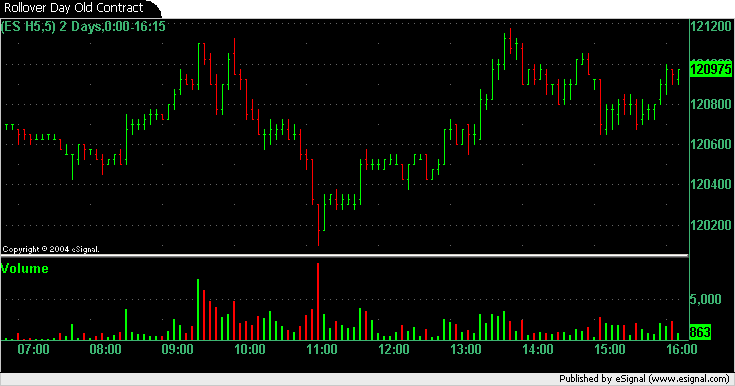
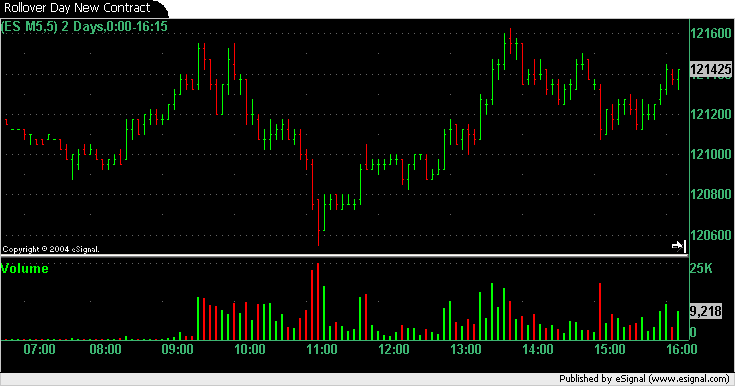
11 March 2004
The two attached charts show March 2004 and June 2004 contracts (in that order) for the ES 5 minute for 11 March 2004 - rollover day. Notice how the volume has switched from the old to the new contract. Please note the volume scales on the right hand side: the March contract is scaled to 5K and the June contract to 25K. After an initial flurry of activity between 09:30 and 10:00 there is not much volume in the March (near) contract until the end of the day when it picks up again whereas the June (next) contract, which has become the lead month, sees very good volume.
Copyright © 2004-2023, MyPivots. All rights reserved.