The Turtle Trading System
The Theory behind the Turtle Trading System
The System
The Turtle Trading System is not complicated. In simple form, you buy the 20 day breakout (to the upside) and sell the 20 day breakdown (to the downside). That's it!
You still need to consider money management, stops and targets once you have the above entry signal but the system is not complicated and anybody can trade it on any future. (I state future here instead of instrument because the theory doesn't hold for stocks but does hold for options.)
The Theory
In my opinion, the theory behind it is sound. The first time we break a 20 day range in either direction we have a situation where half of the contracts in the market are sitting on losing positions and the other half on winning positions.
If we also assume that the position sizes that each long and short person/institution is holding is the same then we can say that there are the same number of people/institutions which are long and short. Given that assumption (which is not an unreasonable one) we can say that half the market is sitting on a losing position and the other half on a winning position.
The Theory (cont.)
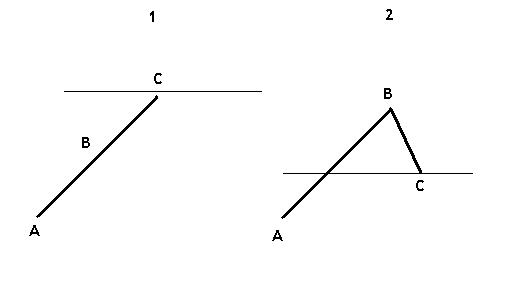
Take a look at this graphic which depicts 2 hypothetical
markets. Market 1 is a bull market which has risen from point A
through point B and is now at point C. Everyone who entered a short
position and is still holding that position during the time period
from point A to point C is holding onto a losing position. Imagine
that point A was 20 days ago and all market participants entered
from point A onwards.
Now look at market 2. This market has retraced 50% of the
move from point A to B. It is possible that all of the open
interest in the market at point C is profitable or at breakeven. In
other words, all of the shorts that are being held at point C were
entered above the horizontal line and all of the longs where
entered below the line.
We now have a situation where in market 1 we have a market where 50% of the open interest is losing money. In market 2, 100% of the open interest is either profitable or at breakeven.
So what has this got to do with the Turtles? The Turtle Trading System is a breakout system. We buy the 20 day breakout. Point C in chart 1 is a breakout. The upward pressure on the market is exacerbated by the losing positions being closed out or reversed to the long side. Losing shorts are being forced out of the market or are electing to exit the market because of their stops. This is adding fuel to the long side. In chart 2 we don't have pressure from either side. Both longs and shorts are sitting on profitable positions and nobody is being forced to do anything.
The Theory (cont.)
There are a million other market factors at play in these 2 hypothetical markets that I have presented above. However, given that the back ground and all other factors could be the same the theory, in my opinion, is a good one.
The Turtle Theory - or rather my interpretation of the Turtle Theory - is that at the 20 day new high/low point we have a situation where the market participants who are holding losing trades are being forced out of the market with their stops which is adding fuel to the prevailing market direction. This is why there is a greater probability for the current market move to prevail and not retrace.
Copyright © 2004-2023, MyPivots. All rights reserved.