Chart Types
Four types of candle charts
To my knowledge there are 4 different ways to build a candle in a Japanese candle chart. You can build each candle (or bar as some call it) based on time, ticks, volume or range.
Time: After a period of time you take the open, high, low, and close during that period and plot that as a bar. The period of time can be anything from a few seconds to months, years or decades.
Ticks: A tick is a single trade irrespective of size. A tick chart builds each bar based on a certain number of ticks per bar. A 233 tick chart will create a new bar after every 233 trades have gone through.
Volume: A new bar is created after a certain number of contracts have been traded. For example, every 2000 contracts a new bar is shown.
Range: A new bar is created when the price trades outside the defined range for each bar. These charts are also called momentum charts. By definition the closing price is either the high/low of the bar and the opening price is 1 tick above/below the previous bar.
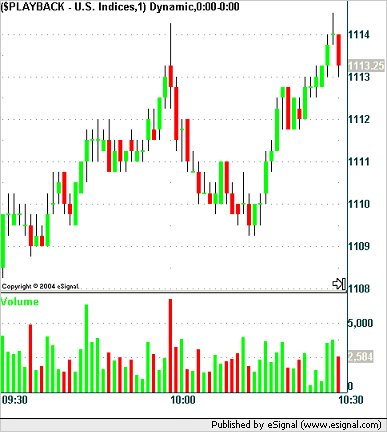
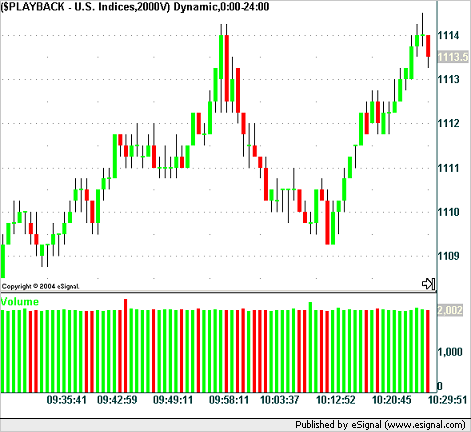
Here is the same 1 hour segment in the market on 3 May 2004 from 09:30 to 10:30 EST for the ES contract showing what 3 of the different charts look like for a 1 minute, 2000 volume and 233 tick chart.
ES 1min candle chart from 09:30 to 10:30 EST on 3 May 2004
ES 2000V candle chart from 09:30 to 10:30 EST on 3 May 2004
ES 233T candle chart from 09:30 to 10:30 EST on 3 May 2004
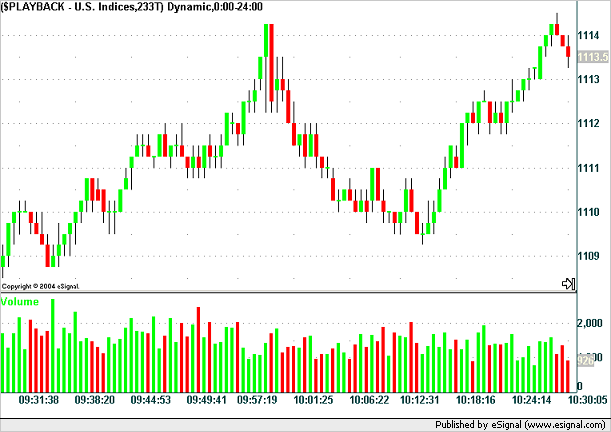
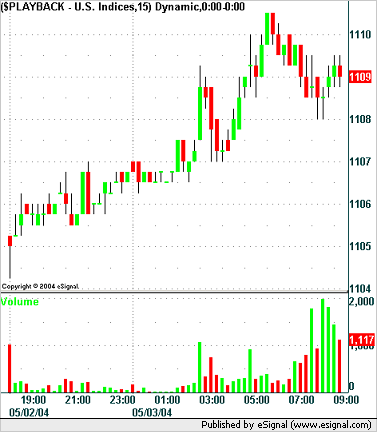
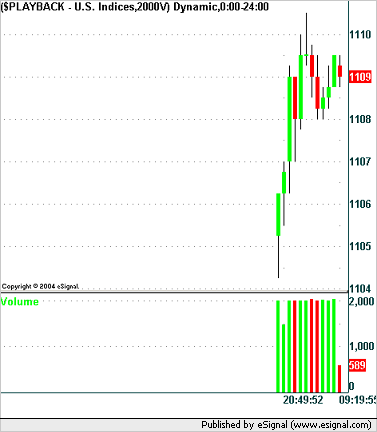
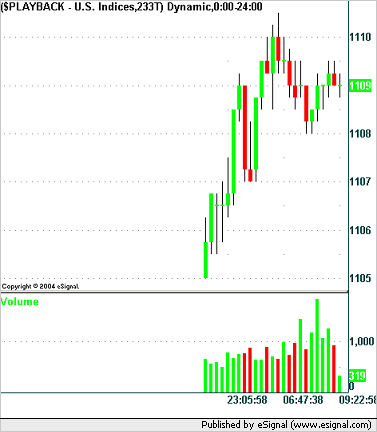
As you can see the 3 charts exhibit very similar patterns under these conditions because the average volume and number of trades can be roughly equated to a time period during high volume periods. The charts take on a completely different characteristic when the volume and number of trades drop. Consider the following similar charts that show the market action overnight and up to 09:15 EST on the same day as the charts above. The settings are the same except for the time based chart which shows a new bar every 15 minutes.
ES 15min candle chart to 09:15 EST on 3 May 2004
ES 2000V candle chart to 09:15 EST on 3 May 2004
ES 233T candle chart to 09:15 EST on 3 May 2004
Moving averages and other derived indicators from a price based chart usually use the closing price of a candle. Indicators are usually based on a number of bars and this will affect the signal given by indicator depending on the chart type (and hence number of bars).
It is my opinion, that the tick chart serves little purpose and is dangerous and if you want to use a size based bar chart you should use a volume based chart instead. Note that I say that this is my opinion. Let me know if you don't think that this is the case.
A tick chart creates a new bar ever X number of ticks. Let's assume that X in this case is the popular value of 233 used in a lot of tick charts. If 233 trades of 1 contract each are traded sequentially then a new bar will be formed. If 233 trades of 200 contracts each are traded sequentially then a new bar will be formed. In the first case we have 233 contracts being traded and in the second case we have 46,600 contracts (233 * 200) being traded. This example, although extreme and unlikely, is a possibility and less exaggerated examples of it are obviously more likely than this example. The volume chart address this issue and rolls onto a new bar every X number of contracts traded.
It is (again this is my opinion) volume that pushes the market and not number of trades and that is why I feel that the tick chart should be abandoned in favor of the volume chart if it is size based bars you are looking for.
Subsequent to writing what you've read above I've been introduced to Momentum or Range bars. These do not (in my opinion) strictly fall under the candle bar category because the closing price of a momentum bar is always at the high or low of the bar so you only have 3 different values in the bar and not 4 as in a traditional candle bar. These will be discussed on subsequent pages.
At this point in time I do not have any examples of range/momentum charts to show you.
Final Note
If you are using eSignal and wish to experiment with different chart types then here is how you do it:
In the Interval box on an advanced chart enter:
233T - to create a 233 tick chart.
1 - to create a 1 minute chart.
2000V - to create a 2000 volume chart.
150S - to create a 2.5 minute chart.
Uniform comparisons
In order to provide a more uniform comparison of the 3 main chart types that I discussed on the previous page I have taken 1 day and time period and compared time, tick and volume charts across this time period. (I have excluded range/momentum charts from this article.)
What I am looking at here is the S&P e-mini contract (ticker symbol: ES) on 10 September 2004 from 09:30 to 16:15 EST. This timeframe is also know as RTH - Regular Trading Hours.
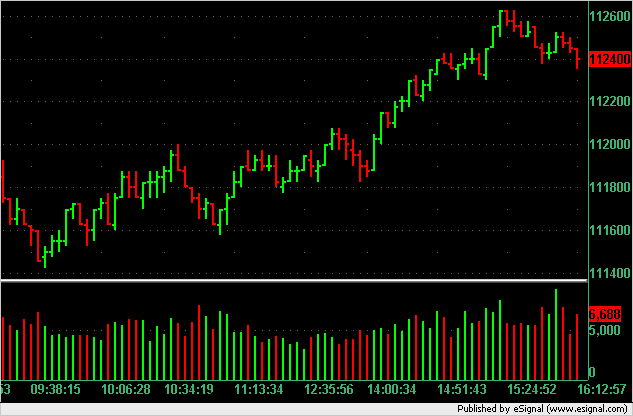
Here is the 5 minute chart for this period with volume:
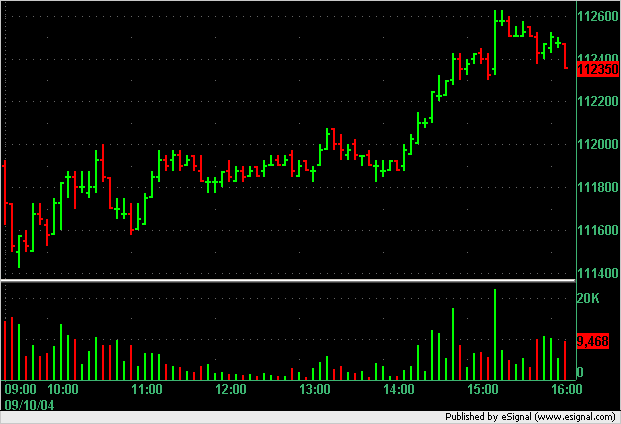
From 09:30 EST to 16:15 EST we have 405 minutes which means that the above chart shows 81 bars of data (405/5).
During this period we had 439,068 contracts traded in 67,090 trades. As an aside and just for your interest that's an average of 6.5 contracts per trade (tick). Please remember that a tick chart counts each trade (irrespective of number of contracts traded) as one tick and so a trade in this context is the same as a tick. The word "tick" takes on a number of different contexts and meanings in the trading environment so don't be confused by its use here.
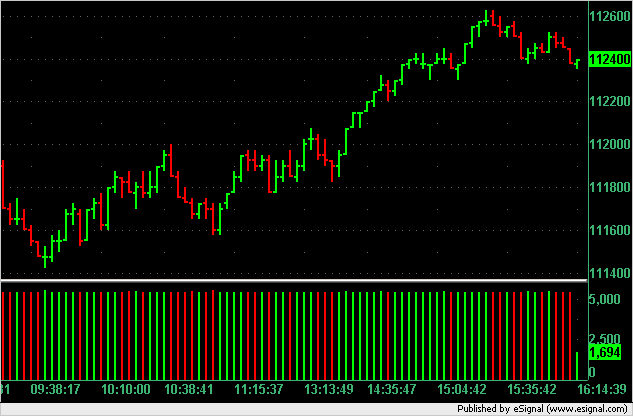
Given that we have 81 bars in the time based chart I decided to replicate the 81 bars in both a volume and tick based chart to see how the shape or pattern of the chart might change if it was based on a comparable chart. Here I am assuming that comparable means same number of bars over a given time period. Of course you may and anyone can come up with many different definitions of what is "comparable."
So with a total volume of 439,068 and a desire to produce 81 bars we have a volume chart based on 5,420 contracts per bar (439,068 / 81). That also means that we need to use a tick chart of 828 ticks per bar (67,090 / 81).
Here are the two charts:
5,420V Chart
828T Chart
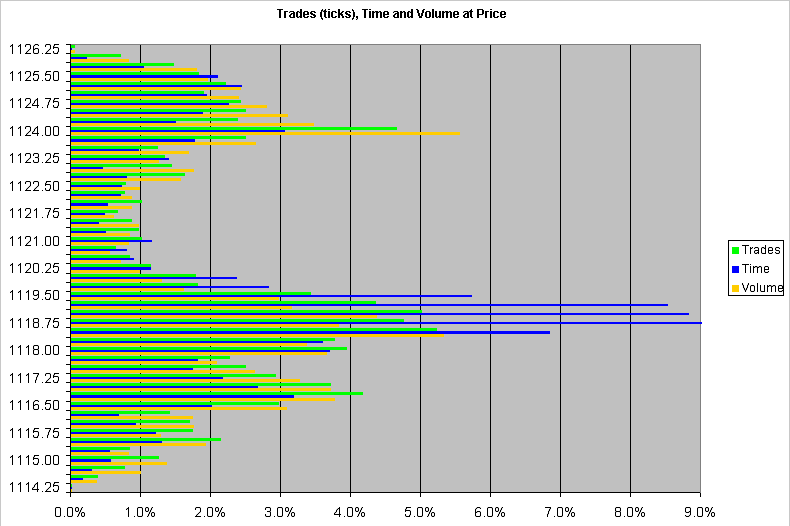
In order to perform another comparison of the data and what we are trying to isolate I decided to turn the data on its side and compare the ticks, time and volume that occurred at each price level. Here is that chart. Take a careful look at what I've produced. On the x-axis we have percent or each of the 3 categories in order to normalize comparisons. Note how around the 1118.50 to 11120.00 price range (which happened mainly at lunchtime) the percentage of time spent here is high but more importantly there is a higher percentage of trades (ticks) than there is volume at each price. What does this tell us? This very simply tells us that the small players are trading with small lots. Of course it could also be large players putting through their orders in small lots as well in order to (1) disguise themselves as small player and/or (2) not to move the market too much while build up positions.
When we move up to higher prices which occur later in the day we can see that there is more volume moving the price showing larger players moving the markets as opposed to the small lot players we saw during the lunch period. We assume here that the large players are the professionals and hedge funds and are also more successful that the small players. So what does this tell us? If that (just stated) assumption is true then it tells us that when we see a market with lots of ticks in small lot contracts flowing through the market then we are seeing amateurs at work and when the big players are active we're seeing professionals at work. Which price action is more important to watch? The price action generated by professionals or by amateurs?
Some of you may be interested to know how I generated the above chart. (If you're not interested then skip this paragraph.) In my research and studies of the market I have written a fairly sophisticated back testing, market analysis and statistical sampling application which I call The Trade Engine. Don't worry - it's not for sale so this isn't a sales pitch here. [For those techies out there it's written in C#.NET and uses any streaming data source or replicate which can come from a data file, data base or live data streaming system.] I added a module onto the system to generate the text file in this zip file and from there generated the XLS in the same zip. I took a tick file generated by eSignal and ran it through the application. To record the trades and volume at each price is fairly simple but the time at each price is a bit more difficult. I chose to select the number of seconds that elapsed after a trade was traded at a price as the time traded at that price. There are a couple of other ways you could measure time spent at price (for example half the time period before and after a price was traded or the time period elapsed up to the price traded) but I chose the one I've just described.
This may look like I've wandered somewhat off topic here but showing the Trades, Time and Volume at Price in this fashion I believe is an objective way of combining the 3 aspects into one pictorial representation which can prove to be an accurate comparison tool.
But what are we trying to achieve with all of this? In my opinion we are trying to ascertain a bias for using one chart type over another to give us an advantage in the market that other traders don't have. The tick and volume based chart solve the "problem" we experience in a time based chart that when nothing happens in the market the chart is still printing prices and the indicators that we derive off those prices are not as informative because they are based on a sideways non-active market which often happens during a lunchtime period. So in order to solve the "time problem" (if indeed you consider a time based chart to be a problem) we can choose a tick or volume chart. Which will it be? Well as you can see from the presentation above the small players are still active during the quiet periods of the day and are generating plenty of ticks during those quiet periods. This lead me to suspect that a tick chart would therefore not be as useful as a volume chart but based on the 81 bars during RTH I see very similar signals between the tick and volume charts and this does not point me to a preference of one over the other.
Here I present the same 3 charts except this time I have added a 20 SMA on all the charts and a white arrow showing the final cross up buy signal from the price crossing (from under) the 20 SMA and also a green arrow showing a low price dip just before 11:00 EST.
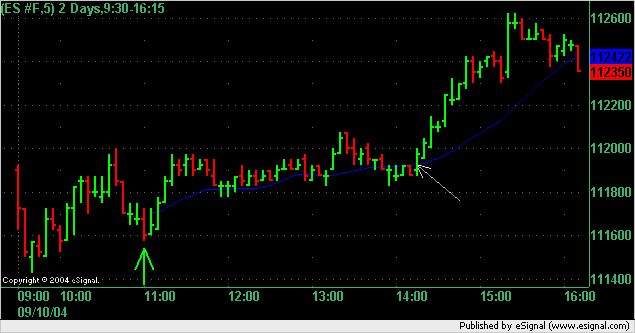
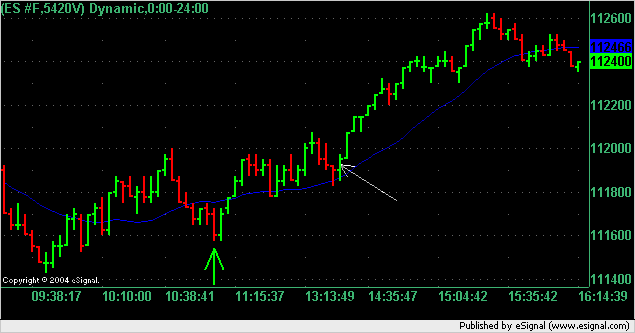
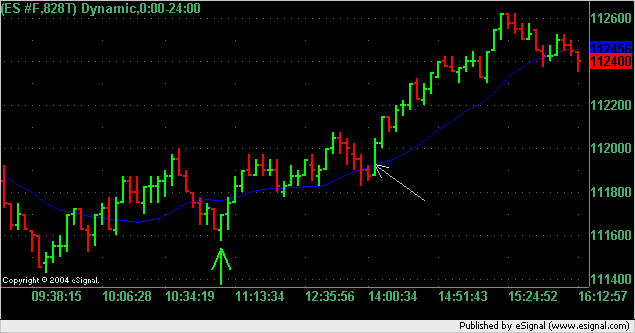
Notice that about 50% of the x-axis is taken up by the points between the green and white arrows on the time based chart and only about 25% of the x-axis on the tick and volume based charts. This is because very few ticks and contracts (volume) flowed through the market during this time period and as such the time based chart appears to distort the true flow of money.
It's no secret that tick charts worry me. This is because they are open to manipulation. Why? If a big trader wanted to buy 200 contracts at market he could do it as a single 200 contract trade which would show as 1 tick (assuming that there are at least 200 or more contracts currently on offer) or if he had a sophisticated trading platform (which a large trader who wanted to manipulate the markets would have) then he could tell his trading platform to release 200 by 1 contract buy orders which would generate 200 ticks. On a volume chart this would make no difference but on a tick chart it would. Say you were looking at a 50T chart. The first method of executing the trade would contribute 1/50 or 2% of a bar on a 50T chart whereas the second method would be the equivalent of generating 4 bars on that chart.
So using the data from this day in time let's have a look at how many bars are generated during a given time period using tick charts and volume charts. We have already isolated the times and prices at which larger lot sizes are flowing through the markets so I have done a calculation using a high tick period and a high volume period to show you the difference.
In order to get a higher resolution and greater number of bars I have quadrupled the number of bars in each of the volume and tick charts. This means using a 207T chart and a 1355V chart. These values are one quarter of what you have been looking at in the charts above.
If we look at the time period between 10:56:38 EST and 14:05:04 EST we have a high tick period versus volume period. I have labelled this P1. I have also isolated the time period between 15:20:23 EST and 15:24:52 as a high volume versus tick period and labelled this P2 in the table below.
| Period | Number of Volume Bars | Number of Tick Bars |
|---|---|---|
| P1 | 76 | 91 |
| P2 | 15 | 11 |
The reader will notice that the time period is over 2 hours in P1 and under 5 minutes in P2. Time doesn't matter on tick and volume charts. That's the whole point, we're removing the time element from these charts. However, I need to use time in order to isolate the two periods for comparison because when we trade we actually trade at a point in time and we cannot avoid that in the real world where we have a time continuum.
What I'm demonstrating with the table above is that when the small players are active during P1 they generate more bars on the tick based charts. This will obviously generate a different indicator value for a tick based chart during this period. If you were looking at a 50, 100 or 200 bar moving average, then during the same time period the tick based chart will be using more bars during P1 to calculate that MA than the volume based chart.
When we move to P2 that situation reverses. During this period there are more large lot contracts flowing through the market which causes more bars to be generated on the volume based chart. Likewise an MA on the volume based chart will have more bars to calculate its value than on the tick based chart.
If you use a tick based chart then you can show the volume as a separate panel/indicator and that will let you know if the bars are being generated based on small or large lots being executed. On a volume chart there is obviously no point in showing the volume per bar because it will always be the same.
The two important items I would like you to take away from this write-up are:
1. Any indicator that you use that is price based (derived) and is also based on a look back period will have its value influence by the type of chart you use and you should be aware of that and how different periods of the day or market environments would change these readings.
2. Use what works for you. If you have a strategy based on a tick chart that makes you money then stick at it. If your tick chart based strategy fails under certain market conditions you may be able to improve its performance using some of the comparisons that I've presented here.
How Steep is your Chart?
How steep are the trend lines on your chart and should they be that steep? The effect of selecting the right chart type for you.
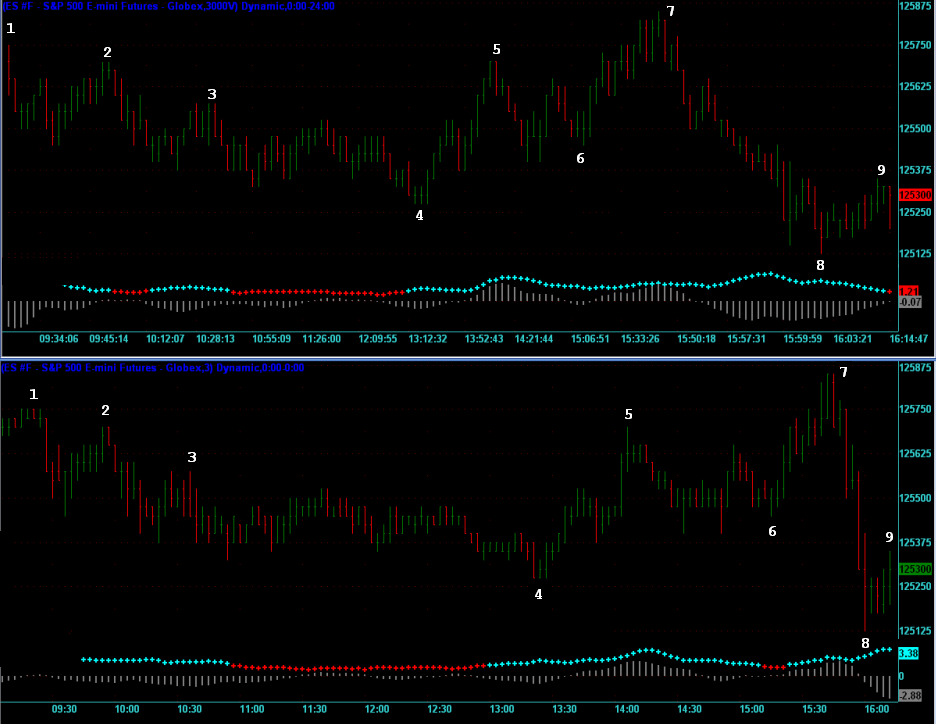
In the image below we have the following. The top chart is a 3,000V chart and the bottom chart is a 3 minute chart. The both start at exactly the same time on the same date which is just before 09:30 ET on the last day of trading for 2005 the 30 December. Each number on the upper chart marks a number on the lower chart. Below each chart is an indicator with the same settings in each chart.
What I find interesting here is the steepness between points 7 and 8 on the time based chart and how the chart is stretched out between points 3 and 4 on the same chart.
This next chart below is exactly the same chart that I drew previously except that I've added 2 lines to each chart which join the same points on each chart. What I want you to notice is that the first line from points 4 to 7 are almost parallel and have the same gradient while those from points 7 to 8 are radically different.
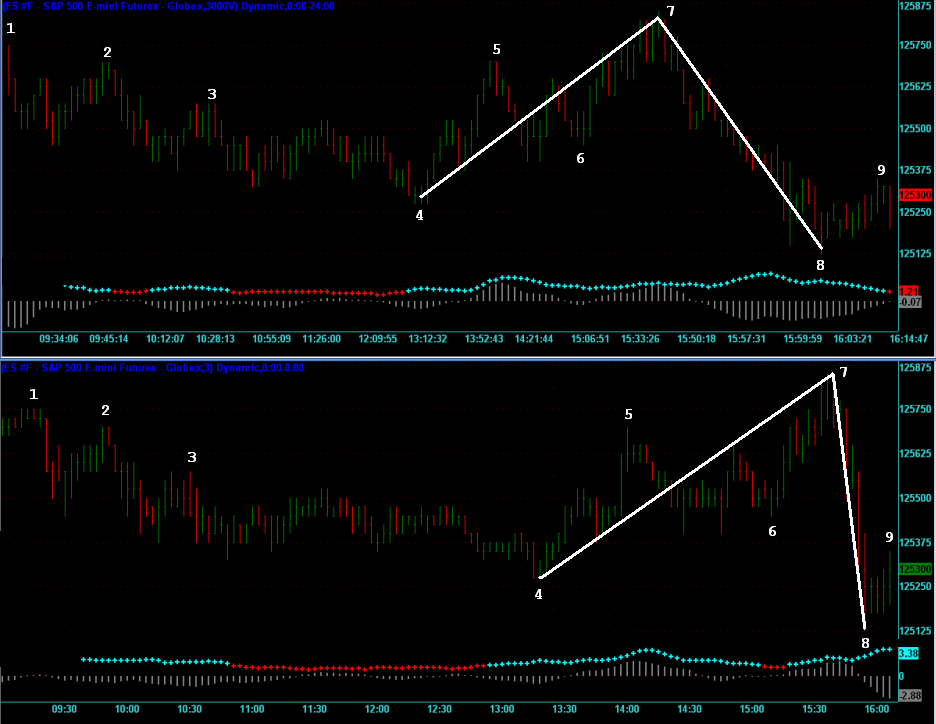
As you can see, the indicators show different signals on each chart except just before point 4 where they show the same signal. This is because the bars on each chart are spaced differently because of the way that they are built.
I'm not trying to get you to choose one type of chart over the other but just make you aware of how time and volume charts differ and give you some things to look at. This isn't a bad exercise to do in the evenings when you are reviewing the day's trading. Take a look at your charts in a different light.
Copyright © 2004-2023, MyPivots. All rights reserved.