Globex Overnight Highs and Lows
Hi. Is there a website where I can find globex overnight highs and lows for the ER, ES, NQ & YM? THanks.
Not that I'm aware of - I have never seen one. What exactly are you looking for and why? For example from when to when do you want to know the highs and lows? Midnight to 9:30am EST?
I'm looking for the highs and lows from close of market to market open the next day. Would be using them to identify potential support and resistance points.
Thanks.
Thanks.
The reason that those aren't published is that they would have to be published at 9:30 AM EST exactly and so most people trading at that time will see those figures on their charts.
If a web site were to publish them then there would be some possible latency and you might miss the first point of support or resistance which would make this an ineffective way to get the information.
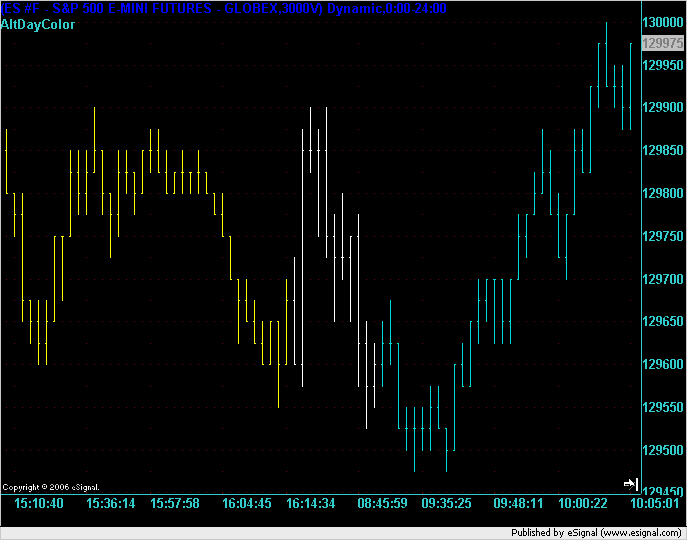
What charting package are you using? One of the ways that I look at the overnight high and low is to use an indicator called AltDayColor on a volume chart which alternates the colors of the different times and days. What it does it to change the color of the bars each day and also give the overnight bars a different color. Here is an example of last night's overnight in the E-mini S&P500. The chart is a 3,000 Volume bar chart.
The big advantage (for me) in using this type of chart is that it compresses the lack of activity into a few bars which I believe is the most efficient and effective way to look at the market. (I can explain that more later if you're interested.)
If a web site were to publish them then there would be some possible latency and you might miss the first point of support or resistance which would make this an ineffective way to get the information.
What charting package are you using? One of the ways that I look at the overnight high and low is to use an indicator called AltDayColor on a volume chart which alternates the colors of the different times and days. What it does it to change the color of the bars each day and also give the overnight bars a different color. Here is an example of last night's overnight in the E-mini S&P500. The chart is a 3,000 Volume bar chart.
The big advantage (for me) in using this type of chart is that it compresses the lack of activity into a few bars which I believe is the most efficient and effective way to look at the market. (I can explain that more later if you're interested.)
Click image for original size
Thank you for this, I very much appreciate your time and interest.
I've been using Q-charts for the past few weeks, but just last night figured out that there is a way to get my emini charts to show the overnight sessions. I figure to just indicate the overnight highs and lows on my day session chart and not display the overnight bars for the same reasons that you refer to.
Qcharts does not seem to have an equivalent for alt day color, but I'll check with tech support Monday.
Cheers!
Also check to see if Q-charts have Volume charts as an alternative to time based charts to give you a better overnight picture. You will notice that some overnight activity is 2 or 3 times more in volume than other ovnight activity which is (in my opinion) significant.
Emini Day Trading /
Daily Notes /
Forecast /
Economic Events /
Search /
Terms and Conditions /
Disclaimer /
Books /
Online Books /
Site Map /
Contact /
Privacy Policy /
Links /
About /
Day Trading Forum /
Investment Calculators /
Pivot Point Calculator /
Market Profile Generator /
Fibonacci Calculator /
Mailing List /
Advertise Here /
Articles /
Financial Terms /
Brokers /
Software /
Holidays /
Stock Split Calendar /
Mortgage Calculator /
Donate
Copyright © 2004-2023, MyPivots. All rights reserved.
Copyright © 2004-2023, MyPivots. All rights reserved.