DSS Indicator
quote:
Please could you direct me to a thread in the forum which discusses the use of the DSS indicator, I can't seem to find one.
I couldn't find one either so that means that no one has discussed it on the forum before.
DSS stands for Double Smoothed Stochastic.
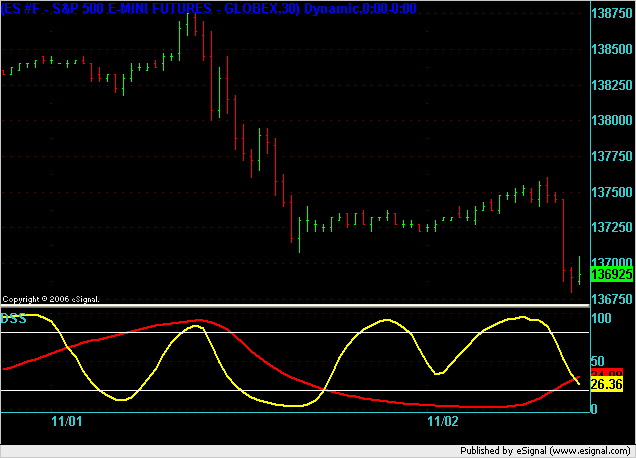
Here is a chart with the double DSS indicators. One is fast and one is slow. The objective here is to capture both the short and medium term highs and lows in the market movement. This is a type of "double confirmation."
In this particular example you see the indicator working. However, before you use an indicator like this you should make many observations and count the number of times that it worked and that it failed. You then need to overlay your money management onto the indicator. Even though it works, it is possible that your money management could have stopped you out early in the trade and you would not have had a winning trade.
Trade safely!
Click image for original size
In this particular example you see the indicator working. However, before you use an indicator like this you should make many observations and count the number of times that it worked and that it failed. You then need to overlay your money management onto the indicator. Even though it works, it is possible that your money management could have stopped you out early in the trade and you would not have had a winning trade.
Trade safely!
Here are some tips for evaluating the usefulness or viability of using this or any other indicator in your charts for day trading. We are typically looking at using this on 1,2,3,5, and 10 minute charts although there is no reason why this could not be use on other time frames and tick and volume charts as well.
When you're looking at the charts then take a look at the double confirmation of the DSS and count through the number of times that it was "right" and how right it was. In other words, is it even in the ballpark of being a usable indicator. The number of times that it is right gives you the win/loss ratio. This is useful if your targets and stops and the same size.
If your targets and stops are different sizes then you need to see how right it was when it was right. This allows your win/loss ratio to be lower if you're taking bigger profits when it wins.
Now move the chart such that you can see the signal developing on the right hand side of the chart but not the end result. Evaluate on which bar you consider the signal complete and work out how and when you would have entered. If, for example, you wait for a bar to complete on the time frame that you are trading then you can probably realistically allow yourself an entry of 1 tick worse than the opening price of the next bar.
This entry point is important because it will determine if you are stopped out or not. Usually, the highest chance of being "unluckily" stopped out on a good trade is right at the beginning in the first few minutes.
So even if the indicator is signaling a great trade that doesn't help and is not useful if you've been stopped out shortly after your entry. By determining your entry rule (e.g. open price of next bar less one tick) you will be able to determine the number of times you will be stopped out on what could have been a big winner.
Remember that you will be stopped out on some "good" trades and that's how it goes so make some allowances for that while evaluating.
Emini Day Trading /
Daily Notes /
Forecast /
Economic Events /
Search /
Terms and Conditions /
Disclaimer /
Books /
Online Books /
Site Map /
Contact /
Privacy Policy /
Links /
About /
Day Trading Forum /
Investment Calculators /
Pivot Point Calculator /
Market Profile Generator /
Fibonacci Calculator /
Mailing List /
Advertise Here /
Articles /
Financial Terms /
Brokers /
Software /
Holidays /
Stock Split Calendar /
Mortgage Calculator /
Donate
Copyright © 2004-2023, MyPivots. All rights reserved.
Copyright © 2004-2023, MyPivots. All rights reserved.