Probabilities
A comment that I just made in this topic Markets in Profile got me thinking about probabilities and I thought that it deserved its own thread.
Success at trading is all about have the probability of winning in your favor. That's a simple statement and it's how the casinos make money day in and day out.
One of the problems we face as traders is the calculation of the probability. How do we know if the series of trades that we are taking really does have a higher probability of success or not?
Well, for one thing we can back test our strategies. But that doesn't always give us the probability factor because of the many complexities of back testing.
Another is to do pure statistical testing of price movement after a signal. This is a type of back testing but without using money management.
In many ways I think that there is a lot of merit in having a very simple money management strategy of all-in and all-out and use probability of movement rather than trying to fool around getting the nuances of scaling in and scaling out down to a fine art.
There are two approaches to this all-in all-out strategy. You can find a signal that will "move" the market (1) more in one direction than the other 50% of the time or (2) the same amount in one direction a higher percentage of the time. You then go all in at entry and all out at target or stop. So long as the probabilities remain in your favor it is then a matter of repeating this as often as possible.
Examples in the E-mini S&P500:
(1) Your signal shows that the market will move at least 3 points in one direction without first moving 2 points in the other direction at least 50% of the time. Your win/loss ratio is 50% but you make on average 0.5 points for every trade you take.
(2) Your signal shows that the market will move 2 points in one direction 60% of the time and 2 points in the other direction 40% of the time. Your win/loss ratio is 60%. For every 10 trades you make 12 points and lose 8 points which is an average of 0.4 points for every trade that you take.
quote:
Originally posted by pt_emini
True, a 60% win probability using a 1:1 risk:reward ratio will lose money over the long term (when commissions and slippage are accounted for).
So while we are considering this point, what is the win probability required to break even with a 1:1 risk:reward ratio using a R/T commission of say $5, 1 tick of slippage on exit, and 1 tick of slippage on stop loss ?
It's actually not as high as one would think. If you assume that you make 8 ticks on the winners and lose 10 ticks on the losers then you need to win 56% of the time to come out ahead. In my opinion, the extra 2 ticks on the losers covers slippage and commissions in the ES. So you have a R:R of 1:1 but in reality you lose an extra 2 ticks when you lose.
If your targets are larger then obviously your commission and slippage per amount gained/lost will drop and so a quick calculation shows me that targets of 20 ticks (5 points) with stops at 5 points (but stops+slippage+commission at 5.5 points) you will need a win ratio of 53% to come out just ahead of break-even.
Those win % requirements are a lot lower than I think a lot of people expect. It is more in line with casino odds requirements which we know work.
On the roulette wheel there are 38 slots. Numbers 1 through 36 and 0 and 00. If you play red/black or odds/evens your chances of winning are 18 in 38 or 47.4% and your chance of losing is 52.6% to put it in perspective.
Are you familiar with a Monte Carlo simulation? It's just a fancy name for throwing hundreds of numbers at a formula and seeing what happens. For example, electronically flipping a coin a million times to confirm that in the long run heads and tails will always come up the same number of times.
I will set-up a spreadsheet and upload it that demonstrates a series of wins and losses. Let me think about how to do it first...
I will set-up a spreadsheet and upload it that demonstrates a series of wins and losses. Let me think about how to do it first...
quote:
Originally posted by day trading
It's actually not as high as one would think. If you assume that you make 8 ticks on the winners and lose 10 ticks on the losers then you need to win 56% of the time to come out ahead. In my opinion, the extra 2 ticks on the losers covers slippage and commissions in the ES. So you have a R:R of 1:1 but in reality you lose an extra 2 ticks when you lose.
Ok 2 ticks covering slippage and commissions, I personally would use at least 3 ticks for this simulation, as my personal experience has at least 2 ticks slippage on entry/exit + commissions. I prefer to be conservative in our assumptions and approximations, however I leave this choice to your good judgment.
I would like to see the math behind the 56% win probability to reach the breakeven threshold, as it is my understanding the win probability to make a profit at 1:1 is above 70%, this may include higher commission and slippage factors than we are estimating here. I don't have the formula to calculate this sitting in front of me at the moment, we need to go dig them up.
OK, I dug up the formulas for this question about the breakeven point....
Breakeven Formulas:
breakeven win percentage = 1 / (( avg profit / avg loss ) + 1)
breakeven win/loss ratio = ( 1 - breakeven win % ) / breakeven win %
So , using the previous example, profit target = 2 ES points and Profit:Loss ratio 1:1 :
avg profit = 2 ES points - 1 tick slippage&commission cost = 7 ES ticks = $ 87.50
avg loss = 2 ES points + 1 tick slippage&commission cost = 9 ES ticks = $112.50
breakeven win percentage = 1 / (($87.50 / $112.50) + 1) = 1 / 1.7778 = 56.2 %
breakeven win/loss ratio = (1 - 0.562 ) / 0.562 = 0.4375 / 0.562 = 0.7778
Not sure where I got the 70% figure from, perhaps I had confused win percentage with win/loss ratio, in any event I stand corrected.
Using the breakeven formulas, I put together this little table of breakeven threshold probabilities...
R:R   win/loss   win %

---   --------   -----

1:1     0.78      56 %

2:1     1.40      42 %

3:1     2.20      31 %

4:1     3.00      25 %

5:1     3.80      21 %
Okay, here is the spreadsheet. This is version 1 of it and it is named as such. Discussion from here forward refers to version 1.
Here is a screen shot of the input and results area:
Click link to access uploaded file:
monte_carlo_v1.xls
monte_carlo_v1.xls
Here is a screen shot of the input and results area:
Click image for original size
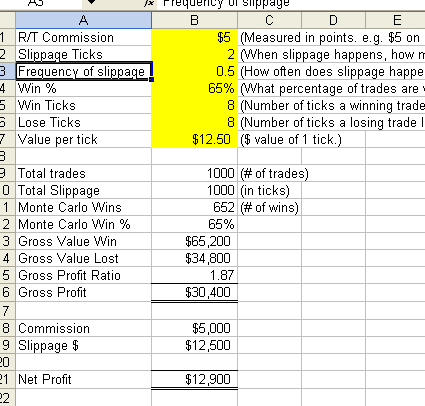
Once you have downloaded and opened the spreadsheet you just need to hit F9 (recalculate) to generate a new set of results. The win/losses are generated randomly with a bias probability towards the percentage that you set.
I think that this is a good tool to demonstrate how easy it is to have good and bad years of trading. If you leave the input figures as they are and hit F9 enough times you will see that you will sometimes have a loosing result over 1,000 trades but more often than not you will have a winning result.
If you execute 1,000 trader per year (about 4 per trading day) then this should give you a good expectation of your results.
Thanks for the break-even table pt_emini!!
Very cool DT ... thanks for putting that together for us to work with.
I want to run a couple basic scenario's through it, will post what I find shortly......
I want to run a couple basic scenario's through it, will post what I find shortly......
I look forward to seeing the results and your comments.
I ran some scenarios through the monte-carlo simulator, my basic goal with this exercise is to compare the theoretical breakeven point (from the breakeven formulas / table above) to the actual breakeven point (as given by this monte-carlo simulation).
For each R:R, there are two rows, the first row is the simulation run that matches the theoretical breakeven point. The second row is the actual breakeven point, where the Net Profit transitions from loss to profit.
Constants:
commission = $5 / RT
slippage = 2 ticks
frequency = 1 (ie. 1 tick on entry + 1 tick on exit)
$/Tick = $ 12.50 (ES)
total commissions = $ 5,000
total slippage = $ 25,000
R:R   win%  win  loss  #win  MC %  win/loss   $ Gross P/L  $ Net P/L

===   ====  ===  ====  ====  ====  ========   ===========  =========

1:1   57 %   8     8   574   57 %   1.35      $ 14,800     (- 15,200)

      65 %             664   66 %   1.98        32,800         2,800


2:1   42 %   16    8   427   43 %   0.75      (- 29,200)   (- 59,200)

      58 %             582   58 %   1.39         32,800        2,800


3:1   32 %   24    8   324   32 %   0.48      (-105,600)   (-135,600)

      56 %             552   55 %   1.23         31,200        1,200


4:1   26 %   32    8   264   25 %   0.36      (-188,800)   (-218,800)

      54 %             540   54 %   1.17         32,000        2,000
One would be better off taking that all or none shot with the don't pass line in craps or banker in baccarat where the house is not as strong.
Emini Day Trading /
Daily Notes /
Forecast /
Economic Events /
Search /
Terms and Conditions /
Disclaimer /
Books /
Online Books /
Site Map /
Contact /
Privacy Policy /
Links /
About /
Day Trading Forum /
Investment Calculators /
Pivot Point Calculator /
Market Profile Generator /
Fibonacci Calculator /
Mailing List /
Advertise Here /
Articles /
Financial Terms /
Brokers /
Software /
Holidays /
Stock Split Calendar /
Mortgage Calculator /
Donate
Copyright © 2004-2023, MyPivots. All rights reserved.
Copyright © 2004-2023, MyPivots. All rights reserved.