Bid Ask Indicator
I would like to start a thread and post some ways I am using the bid/ask indicator I actually bought from Guy, I used to have a different way of charting this, but this is just easier.
I will explain the indicator, my techniques, it's benefits,and it's problems........
I will explain the indicator, my techniques, it's benefits,and it's problems........
I look forward to hearing how it is being used. For anybody not familiar with the indicator I believe that pem06081971 is referring to the Bid/Ask Indicator.
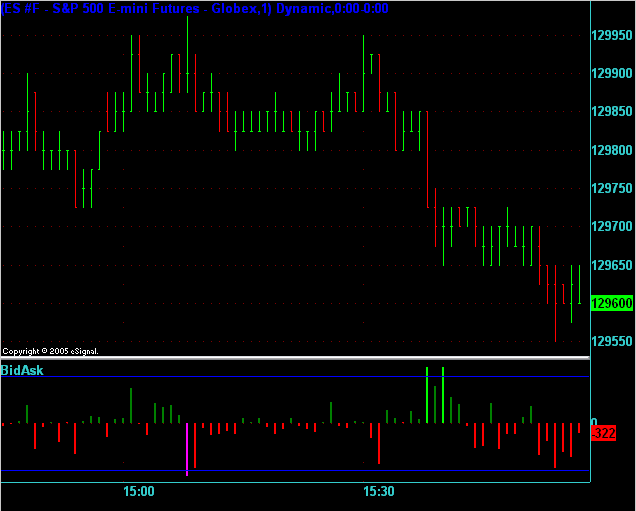
In summary, it's a historgram under the chart showing which side of the market most of the trades occurred on. Here is an image from the page just referred to:
In summary, it's a historgram under the chart showing which side of the market most of the trades occurred on. Here is an image from the page just referred to:
The bid/ask indicator essentially tells you the following in a graphical form.....if buyers are stepping up and hitting the offers or if sellers are jumping out and hitting the bids. It can indicate other things as well, the buyers willing to buy the offer or "go in at the market" are drying up, and the reverse is true as well. I would love to say that at tops or bottoms there are always perfect divergences, for instance price makes a higher high, and the indicator makes a lower low, but this is not always the case. You will see this sometimes, but unfortunately, it is never that easy in this business. The cool thing is this is what I call a "ral time/real information" type of indicator, it is not a dubious mathmeatical formula that attempts to measure the market and prints out squiggly lines that are lagging way behind.
Before going further, this is what it looks like:
Before going further, this is what it looks like:
Click image for original size
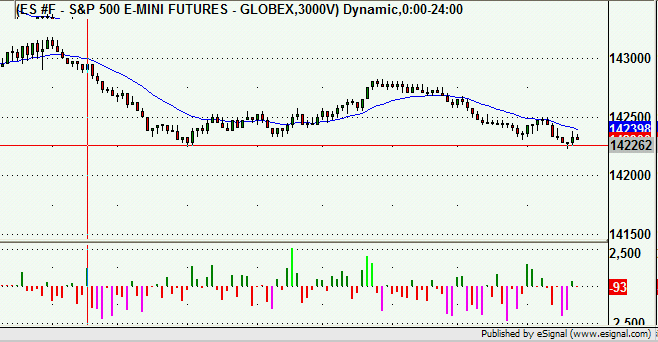
I'd like to point out that pem06081971 is using a 3,000V chart. This is a chart that starts a new candle every 3,000 contracts traded which is approximately equivalent to a 1 minute candle chart but removes "unfairly" weighted candles because each candle has the same number of average participants.
Also, please forgive my typos....I try..........
I had used a similar indicator previously and I suspected the following, which Guy seemed to confirm, it works better with tick or volume charts. On the charts I am posting, you will see that each candle is formed when 3000 contracts traded....that could take seconds, minutes, hours depending on the volume.....I also currently only use this in the ES, I have not been able to uncover reliable patterns in other markets,you see some of the same things, however, it is not always consistent. but if you want to try, keep in mind that you will need to adjust the size of the volume bars for each market, with the YM trading 100,000 contracts a day, and the ES close to 1,000,000..you need to make adjustments. I think this technique will defintely work best on the ES because of the size that is being traded. You aslso need to take into account the participants in the market as the may cause the indicator to look strange, It may be that certain markets like the ZB or ZN (electronic bonds) are more professional buyers and sellers then say the $5.00 Dow, at least intraday. I THINK pros are more likely to be bidding and offering then chasing markets with market orders. I think the ES is a nice mix of pros and retail with good volume. If people insist on looking at other markets, the Russell looked OK, and to my surprise the electronic crude contract, while low volume, looked pretty nice as well. I have honestly not traded the crude mini ever, and I do not use this technique on the Russell, so for all intents an purposes, this is purely an ES deal for me. I will get to some charts next. By the way, I am open to any comments positive or negative. I want to make clear that this is NOT my only trading strategy and frankly depending on the action, there are days I do not use this at all.......also, I tried to show this to a friend of mine who is a somewhat successful "intrady position trader" it was of little use to him. In a fast market you can get a setup and loose the edge very quickly, if you miss it, let it go.......you need to have a real scalper mentality for some of these setups. Essentially we are watching pure price action. That being said, I do not trade in a vacum, I will post some charts to show how the indicator works, but I may or may not have taken some of these trades depending on other things I was watching at the time. This is just to show how this can be applied...........
I had used a similar indicator previously and I suspected the following, which Guy seemed to confirm, it works better with tick or volume charts. On the charts I am posting, you will see that each candle is formed when 3000 contracts traded....that could take seconds, minutes, hours depending on the volume.....I also currently only use this in the ES, I have not been able to uncover reliable patterns in other markets,you see some of the same things, however, it is not always consistent. but if you want to try, keep in mind that you will need to adjust the size of the volume bars for each market, with the YM trading 100,000 contracts a day, and the ES close to 1,000,000..you need to make adjustments. I think this technique will defintely work best on the ES because of the size that is being traded. You aslso need to take into account the participants in the market as the may cause the indicator to look strange, It may be that certain markets like the ZB or ZN (electronic bonds) are more professional buyers and sellers then say the $5.00 Dow, at least intraday. I THINK pros are more likely to be bidding and offering then chasing markets with market orders. I think the ES is a nice mix of pros and retail with good volume. If people insist on looking at other markets, the Russell looked OK, and to my surprise the electronic crude contract, while low volume, looked pretty nice as well. I have honestly not traded the crude mini ever, and I do not use this technique on the Russell, so for all intents an purposes, this is purely an ES deal for me. I will get to some charts next. By the way, I am open to any comments positive or negative. I want to make clear that this is NOT my only trading strategy and frankly depending on the action, there are days I do not use this at all.......also, I tried to show this to a friend of mine who is a somewhat successful "intrady position trader" it was of little use to him. In a fast market you can get a setup and loose the edge very quickly, if you miss it, let it go.......you need to have a real scalper mentality for some of these setups. Essentially we are watching pure price action. That being said, I do not trade in a vacum, I will post some charts to show how the indicator works, but I may or may not have taken some of these trades depending on other things I was watching at the time. This is just to show how this can be applied...........
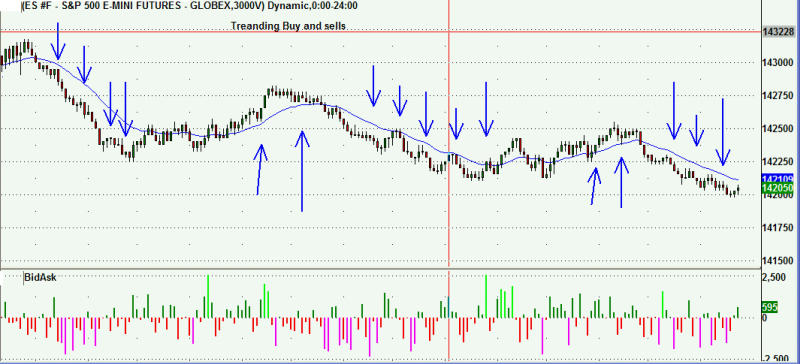
While I had hoped when I first started trying to chart bid/ask ratios, etc that I would uncover some sort of Holy Grail indicator that gave percise divergence signals at highs or lows, or uncovered something I like to call "divergences within trends", it was not to be. It's there but not consistent. I find this indicator to work best in two scenarios, the best is a trending setup. I will post the chart below.....what we are looking for is the market to establish a short term trend, lets say down. (I put a moving average on the 3000v chart, it provides no support/resistance levels as far as I am concerned, it only helps my eye). When we see the market is trending down we are looking for a pull back, what we want to see on the pullback is the bid/ask indicator rise along with the price. This indicates that there is buying pressure coming in, people are hitting the offer, and buying with market orders......then we need to see price stall as the bids/ask falls, I like to see it go negative again indicating the the buyers, or at least the people who feel they "must buy NOW at any price" have all been exhausted....usually the market will continue lower, not always, but it is a pretty consitent trade with minimal risk..........here's a chart from Friday, December 22, 2006
The down arrows indicate potetial short trades, the up arrows indicate potential long trades. Sometimes these work great, other times the follow through is not there, other times it just doesn't work. However, when combined with an overall bias or other indicators it can be very effective. This is not a "system", just a tool I use and really like.
The key is to see the trend and play the pullbakcs looking for the bid/ask indicator to indicate when the buying or selling spurt going against the trend has apparently ended. I also want to state that I believe this works better on the short side, franly I think most intraday trades work better from the short side, perhaps that is debatable. You could probably see some other trades that I could have taken but don't indicate, or others that look dumb in hindsight, this based though on my perception of if the trend was still in tact or not, nothing more. I could have been wrong. Also again, these are examples, nothing happens in a vacum, if I have a short indicated where you went long, it does not mean we don't like eachother, I may or may not have taken the trade, these are examples of how this works.
Click image for original size
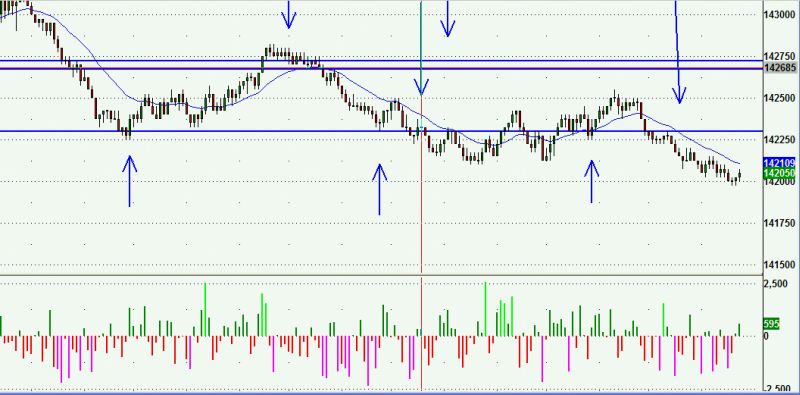
Another way to use this indicator is at defined support and resistance levels....while I actually kind of prefer to be looking at other indices, the Tick, Advance/Decline line when the ES hits one of my levels, the bid/ask indicator can help you as well. Unfortuanately Dec.22, was not a great day for trading my levels, as the market broke down through most of my shorter term numbers and continued lower. The levels on the screen are the Value Area Low and previous day's low at the top, and an old support level from the previous week.........again, this is not to be traded in a vacum, but here are some examples of how this COULD work, I think the trending setups are much stronger though in most cases, I kind of use the volume charts with the bid/ask indicator as more of a timing thing when trading levels, maybe you can figure something out that I am missing.......mostly wha I am looking for at levels are how the market trades around it, I may go into a level anticipating a short trade, but the resistance may turn into support or even a springboard to higher prices.....this is hard to explain, more of a real time thing that comes from experience.
Click image for original size
quote:
Originally posted by pem06081971
Click image for original size
Thanks for posting these charts and explanations. (You may have noticed that I edit the images to make them fit into the forum. It looks like you're using eSignal's Snapshot to capture the images. A suggestion: if you drop the "sights" onto the middle of the chart then it will only capture that window and not your whole screen. Also you can resize the chart before capturing it.)
I was just reading a comment in the pitbull thread about Single Prints and that made me think of this indicator as a confirming indicator for the Single Print strategy. You may have read my 3 months of forward testing with the Single Print strategy in the Market Profile Strategies forum. This strategy proved profitable (if I recall correctly) over the 3 months that it was forward tested. During testing I used this in isolation and I am wondering if this indicator would filter out some of the losing traders.
So my question to you is: Have you used this with the Single Prints like you use it with the VAH and VAL?
So my question to you is: Have you used this with the Single Prints like you use it with the VAH and VAL?
This is a very cool thread/cocept..this is one area of probably many that I have never researched.......since I like to fade rallies and buy declines in general, I look forward to this....this stuff always reminds me of the "traders talking toolbox" or whatever that made the popcorn sound which i never personally had a chance to try out
Bruce
Bruce
pem06081971 - Thanks so much for sharing the concepts you have developed using this toolbox indicator. Guy is a big proponent of the volume charts, and it appears to help with this indicator.
In a pure trend following sense, the basic pattern you outlined will make a nice confirmation signal when entering the trend mid-stream during a pullback (flag) within the ongoing larger price trend. As you mentioned, I would not use this signal in a vacuum, but rather in combination with an additional indicator signal.
In studying your sample charts, one pattern I see jump out at me on your charts is when price makes a new high (or retests it) and the bid-ask indicator is below zero. Conversely, when price makes a new low and the bid-ask indicator is above zero. This signals a divergence or indicator non-confirmation. At which point a larger term retracement or trend reversal begins.
Do you feel this divergence signal is valid or a possible signal/pattern of value ?
In this sense, the bid-ask divergence could be used as an additional confirmation to BruceM's pitbull strategy.
Yes ..more charts please...I'm still digesting this stuff...thanks
Bruce
Bruce
Emini Day Trading /
Daily Notes /
Forecast /
Economic Events /
Search /
Terms and Conditions /
Disclaimer /
Books /
Online Books /
Site Map /
Contact /
Privacy Policy /
Links /
About /
Day Trading Forum /
Investment Calculators /
Pivot Point Calculator /
Market Profile Generator /
Fibonacci Calculator /
Mailing List /
Advertise Here /
Articles /
Financial Terms /
Brokers /
Software /
Holidays /
Stock Split Calendar /
Mortgage Calculator /
Donate
Copyright © 2004-2023, MyPivots. All rights reserved.
Copyright © 2004-2023, MyPivots. All rights reserved.