Pitbull Three Strategy
Here is a strategy which I did not originate. Perhaps some of you have seen or heard about various forms of this. It was taught to me by a self proclaimed “old Timer” who I happened to meet about 5-7 years ago in a commodity site chat room. This was before Paltalk and Hotcomm was popular. I present it here mostly as it was taught to me for free. I “watched” him trade this for about 9 months in real time. It was designed for the big S&P contract so I have modified it slightly for the emini. The man who taught this was gruff, sometimes abusive ( especially when the future vendor Kingfish came in the room) but always answered questions…
Originally I thought he was going to turn out like the Army Sargent played by Lou Gosset Jr. in “Officer and a gentleman” but this mentor just disappeared and I never found him again. Perhaps he started his own service and markets this but I haven’t seen it. His idea on stops was the following….”You can either take the loss and try again or trade your way out”. He always tried to trade his way out and would sometimes lose on trend days… as it is a counter – trend strategy……a few other things….he would call in for the official opening range…( it is not the one minute high or low as some think but we can use that for exits)..I am using the opening price on the emini to set the levels . He would trade up to 50 contracts if he needed to so he was at times adding to a “losing trade” as some might say……he always took a 1.5 point profit target…….he didn’t alter this….I’ll think of other things as we go. He also thought that if the rumors where true and the floor traders where moving to screen trading then this strategy would become less effective…….it is only traded in the first hour and he only broke this rule if he was trying to “trade out”…..keep in mind this was designed when volatility was higher and 5 minute bar could have a range of 5 points…unlike today's markets……I think the levels are most important and although I don’t snap them on my own personal charts I have them written down on paper after the opening….He believed that at 10:30 EST you should close your business up and end for the day…unless he was trying to recover... ok enough of the history
ok first we take the opening price and add and subtract the following numbers
The strategy tends to capitalize on the floors ability to push the market in one direction to sucker in the public for it to then only snap back towards the opening range…I have noticed that it works best when the market is pushed to an extreme of either an overnight high or low or the previous days high or low…so we can relate this to an “open-test-reject” as per Market profile concepts……
+- 2.5
+- 4.0
+-5.5
+-8.0
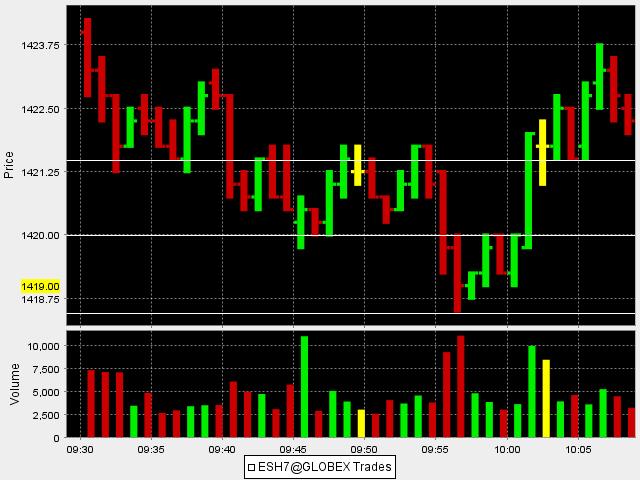
This sets up our WINDOW of trade entry points….For today Friday January 5th I have the opening price at 1424 so the downside numbers would be 1421.50, 1420, 1418.50 and 1416..and here are the rules.
1) If we open and drop down to the minus 2.5 number then rally to the open you buy
2) If we open and drop down to the minus 4 you then buy at the minus 2.5 on the way back up
3) If we drop down to the minus 5.5 you buy the minus 4 number
4) If we drop to the minus 8 you buy the minus 5.5
This is all reversed for the upside.
Anything beyond a plus or minus 8 meant the market was too risky too initiate from down or up from the opening so he avoided it…in general he believed that the further out into the WINDOW you went then the riskier it became…so buying a minus 2.5 after a hit on minus 4 is a safer trade then buying a minus 4 number after a minus 5.5…He didn’t use stops but his target was always 1.5 off the window number ..not your fill price...
You would stop trading if the markets dropped 2.5 points below the opening and then traded 2.5 above the opening…..this would be called a COMPLETED WINDOW RUN and the floor was done doing it’s business…you would be finished also…just one or two good trades a day……for now think about how you can incorporate the Pitbull One and II thread ideas into this……did you see the singles band with the first and second one minute bar today
The Market opens at 1424 and drops down to slightly below the minus 2.5 number at 1421.50…since we didn’t trade back to the opening at 1424 there is no long trade…..The market then drops further and goes to the minus 4 number at 1420 so we are a buyer at 1421.50……which is the minus 2.5…If you use stops then this trade would not have hit 1.5 points of profit and you lose if you are using stops….The market drops further to the minus 5.5 number to the tick at 1418.50..so you are a buyer at the minus 4 which is 1420….this achieves it’s target and rallies up to test the band..see pitbull thread II at the first and second one minute bars…not shown on this chart. ok...this is a lot so I will work on trying to clarify what needs to be clear…the second long was better because we had Tick divergence to support the trade…may seem complicated but it’s not..I’ll highlight the important stuff…..and ask questions...it helps me too to get this stuff in words
Bruce
Originally I thought he was going to turn out like the Army Sargent played by Lou Gosset Jr. in “Officer and a gentleman” but this mentor just disappeared and I never found him again. Perhaps he started his own service and markets this but I haven’t seen it. His idea on stops was the following….”You can either take the loss and try again or trade your way out”. He always tried to trade his way out and would sometimes lose on trend days… as it is a counter – trend strategy……a few other things….he would call in for the official opening range…( it is not the one minute high or low as some think but we can use that for exits)..I am using the opening price on the emini to set the levels . He would trade up to 50 contracts if he needed to so he was at times adding to a “losing trade” as some might say……he always took a 1.5 point profit target…….he didn’t alter this….I’ll think of other things as we go. He also thought that if the rumors where true and the floor traders where moving to screen trading then this strategy would become less effective…….it is only traded in the first hour and he only broke this rule if he was trying to “trade out”…..keep in mind this was designed when volatility was higher and 5 minute bar could have a range of 5 points…unlike today's markets……I think the levels are most important and although I don’t snap them on my own personal charts I have them written down on paper after the opening….He believed that at 10:30 EST you should close your business up and end for the day…unless he was trying to recover... ok enough of the history
Click image for original size
ok first we take the opening price and add and subtract the following numbers
The strategy tends to capitalize on the floors ability to push the market in one direction to sucker in the public for it to then only snap back towards the opening range…I have noticed that it works best when the market is pushed to an extreme of either an overnight high or low or the previous days high or low…so we can relate this to an “open-test-reject” as per Market profile concepts……
+- 2.5
+- 4.0
+-5.5
+-8.0
This sets up our WINDOW of trade entry points….For today Friday January 5th I have the opening price at 1424 so the downside numbers would be 1421.50, 1420, 1418.50 and 1416..and here are the rules.
1) If we open and drop down to the minus 2.5 number then rally to the open you buy
2) If we open and drop down to the minus 4 you then buy at the minus 2.5 on the way back up
3) If we drop down to the minus 5.5 you buy the minus 4 number
4) If we drop to the minus 8 you buy the minus 5.5
This is all reversed for the upside.
Anything beyond a plus or minus 8 meant the market was too risky too initiate from down or up from the opening so he avoided it…in general he believed that the further out into the WINDOW you went then the riskier it became…so buying a minus 2.5 after a hit on minus 4 is a safer trade then buying a minus 4 number after a minus 5.5…He didn’t use stops but his target was always 1.5 off the window number ..not your fill price...
You would stop trading if the markets dropped 2.5 points below the opening and then traded 2.5 above the opening…..this would be called a COMPLETED WINDOW RUN and the floor was done doing it’s business…you would be finished also…just one or two good trades a day……for now think about how you can incorporate the Pitbull One and II thread ideas into this……did you see the singles band with the first and second one minute bar today
The Market opens at 1424 and drops down to slightly below the minus 2.5 number at 1421.50…since we didn’t trade back to the opening at 1424 there is no long trade…..The market then drops further and goes to the minus 4 number at 1420 so we are a buyer at 1421.50……which is the minus 2.5…If you use stops then this trade would not have hit 1.5 points of profit and you lose if you are using stops….The market drops further to the minus 5.5 number to the tick at 1418.50..so you are a buyer at the minus 4 which is 1420….this achieves it’s target and rallies up to test the band..see pitbull thread II at the first and second one minute bars…not shown on this chart. ok...this is a lot so I will work on trying to clarify what needs to be clear…the second long was better because we had Tick divergence to support the trade…may seem complicated but it’s not..I’ll highlight the important stuff…..and ask questions...it helps me too to get this stuff in words
Bruce
I feel it in my bones like a coming storm. They're going to allude to or flat out announce a rate hike to get people on "mainstreet" to put their money back in the bank, which will cause every piker from the artic north to buy until 75 thinking they sky's the limit and size grouchy from a lousy nooner, a six month old brandy uncapped from the last party and news they're closing the window of prime institutional rate, and they'll trap and steal every red cent from pikers to decimate this market. Watch.
thanks guys...appreciate the confluence..ideally I want to get into single prints to get this tightened up...below that 67.25
I think I did two other threads with Pitbull in the title Red....
that add on was two SD's off current VWAP ( at 866) a three sd move will go to Joe's 880........I don't like any of this
somebody else looks lik ethey are selling 73.75 hard....if market delta is working....Gheesh!!
I thought it would be good to have a chart from yesterday's fed day...always tricky....it shows "failures" and stalls at the key numbers and one nice big win. It's great to show profitable trades but understanding how methods fail is more important so we can handle drawdowns while we wait for the next trade. Some of you smarter folks can fiqure out reversals based on these failures......that wasn't me yesterday...
The key zones are snapped off of the opening 860.50 print
plus 4 - 5.5
plus 8 - 10
plus 16 - 20
The key zones are snapped off of the opening 860.50 print
plus 4 - 5.5
plus 8 - 10
plus 16 - 20
Click image for original size
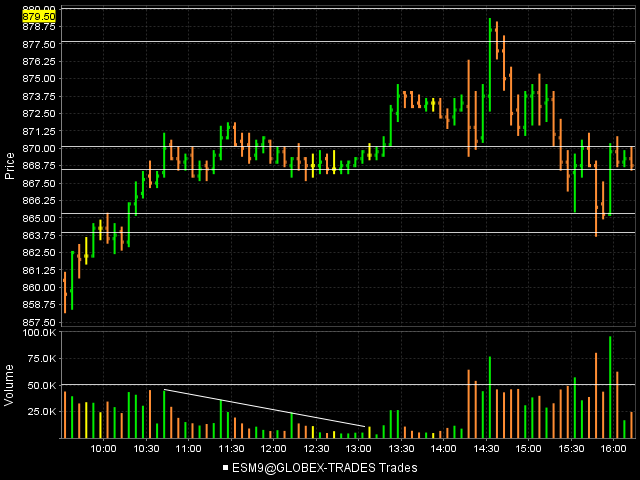
Speaking of the 860.50 opening print yesterday......I just noticed a strange thing here. How do you know what the exact 8:30 am (central) opening price is? All my various trading platforms and chart services call the 3:30 the previous day the open (when the market re-opens after the 3:15 close)
The reason why I ask, today for example, I had 5 different platforms open with bar charts and showed 5 different printed opens! 880.25, 880.75, 881.00, 879.50, 881.25 - They were Interactive Brokers, QuoteTracker, Strategy Runner, SierraCharts, NinjaTrader, and Transact - who is right? lol
The reason why I ask, today for example, I had 5 different platforms open with bar charts and showed 5 different printed opens! 880.25, 880.75, 881.00, 879.50, 881.25 - They were Interactive Brokers, QuoteTracker, Strategy Runner, SierraCharts, NinjaTrader, and Transact - who is right? lol
Originally posted by BruceM
big mike...is this one of bitmans ideas u r using on weeklies
http://community.livevol.com/index.php/articles.html/_/options-trading/spx-weekly-credit-spread-strategy-r3205
Yes it is.
Emini Day Trading /
Daily Notes /
Forecast /
Economic Events /
Search /
Terms and Conditions /
Disclaimer /
Books /
Online Books /
Site Map /
Contact /
Privacy Policy /
Links /
About /
Day Trading Forum /
Investment Calculators /
Pivot Point Calculator /
Market Profile Generator /
Fibonacci Calculator /
Mailing List /
Advertise Here /
Articles /
Financial Terms /
Brokers /
Software /
Holidays /
Stock Split Calendar /
Mortgage Calculator /
Donate
Copyright © 2004-2023, MyPivots. All rights reserved.
Copyright © 2004-2023, MyPivots. All rights reserved.