Weekly pivot influence on first trading day
quote:
Originally posted by BruceM
...I have a friend who will only trade in the direction of the weekly pivot on the first trading day of the week....he uses it like a magnet...so for today he is only taking longs......his is by observation
I'm curious about testing the general theory of this. I'm typing as I think...
If we took the week's first trading day's opening price and measured the number of points that it traded in the direction of the weekly pivot point and also the number of points it traded away... We might be able to measure a statistical deviance in the direction that it trades. Problems with this theory are (1) the market has an upward bias in the long term (i.e. not symmetrical (2) Market Profile theory can replace this because we are probably trading towards the weekly Point of Control which is likely to be near the weekly Pivot Point.
Testing is difficult because we need to compute the first trading day of the week in case it is a holiday and also count the number of trading days in the prior week in case of holidays. For example, last week we had 3 trading days in the E-mini S&P500 because of Gerald Ford's day of mourning. This was an unexpected holiday that is not on the calendars.
What I am thinking of is running a test to see if a rolling 5-trading-day pivot point has any influence on the direction of trade for any particular day-of-the-week. For example, are Monday's more likely to be days where the price is "drawn to that pivot like a magnet" rather than any other day of the week. That should be easier to test...
One more point.
You can test it or backtest it from begining of year. I will use ER, but should work with ES.
If we use the hi and low for the week..Fibonnaci and then look for the mkt to retrace to the 50% level....the 50% level should be close to the weekly pivot point....
Trade to the 50% level every week.............the 50% rule works in position trading on any market...stocks, currencies, commodities etc... you need to have patience on those positions trades to enter and wait...
But I'm thinking about trading weekly..........
Any thoughts anyone???
well there u are...Forecast was right on....
I thought they would start this wed or thurs...but as it started overnight on ER..they took out everyone on this one overnight.
Anyway the target have been met...I was out all day....came in at 3:30 pm to see carnage...although at night when I left Er was at 838. area.
S&p tested its swing low....1515.00 and Er respectifully when down to 812 area. I see the low in July 27 +/1 one day and then could be range and then break out to upside....for now a pop up and then down should occur...to test 1515 and 812.
On ER anytime it has gone down 26/27 pts there is a pop up....but the downtrend is still in...the pop in my mind is to suck in the longs
good luck
They took out the weekly pivot this week. The low put in on Monday is 1460 or so and the weekly pivot is 1490.50....seems like sells up here are a good idea in 93 area..Gap down at 81.50 but my concern is that they broke the weekly pivot by 4.75 points which is close to the 5 point threshold I mentioned in a previous post..we'll see..need to get 5 points below pivot to make this "interesting"
That was cool...now in theory we should be able to sell the first rally back towards the weekly pivot. The 86 to 89 area would be a good point as it falls in the minus 2.5 and minus 5 zone below the weekly pivot..
You can see how we hit plus 5.5 off the opening price to the tic for those who have read the Pitbull thread setup...so nice zone up there.
Bruce
You can see how we hit plus 5.5 off the opening price to the tic for those who have read the Pitbull thread setup...so nice zone up there.
Bruce
here is a chart with the weeekly pivot and the plus and minus 5 numbers snapped on it for reference...
Click image for original size
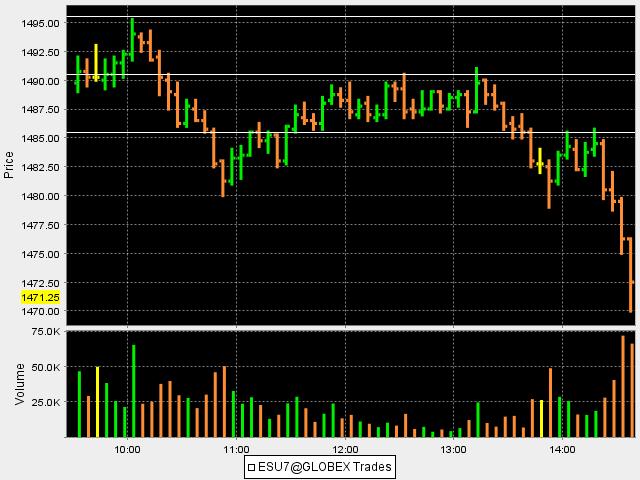
Oh what a beauty..they took out the weekly pivot today..Monday !
BruceM,
How many times have they taken out the weekly pivot point on the first trading day??
Percentage wise?
How many times have they taken out the weekly pivot point on the first trading day??
Percentage wise?
Sorry, I don't know the answer to that. I'd have to go back and look through the thread but I'm not sure I mentioned which day of the week in each post. Attatched is a chart with 3 lines...the weekly pivot line and then the plus 5 point number above and the minus 5 number snapped below...weekly pivot was 1458.25...I didn't want to clutter this up too much but if you put the plus an minus 2.5 numbers on you see some more cool stuff....
Bruce
Bruce
quote:
Originally posted by pips2007
BruceM,
How many times have they taken out the weekly pivot point on the first trading day??
Percentage wise?
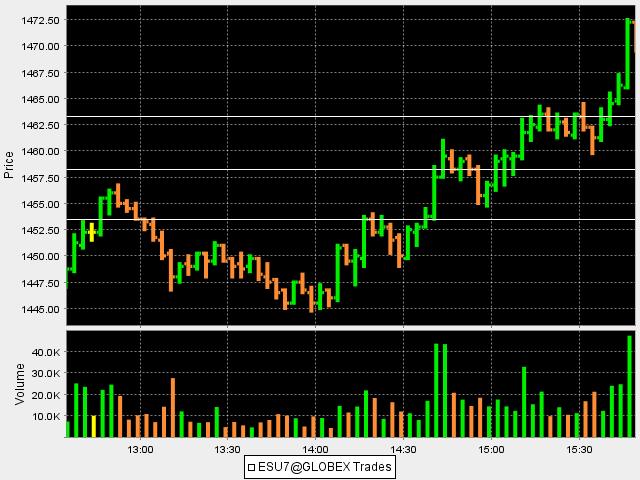
Click image for original size
Hello Bruce
1458.00 was hit and upside was 1473 area and then we have come down...close at 1467.75.
Now how do we play the pivot now? Any suggestions? Just need some clarification on your posts....
tks
1458.00 was hit and upside was 1473 area and then we have come down...close at 1467.75.
Now how do we play the pivot now? Any suggestions? Just need some clarification on your posts....
tks
This is just a work in progress so what I am doing is taking mostly long signals as near the pivot ( if we drop down to it) as possible....for now I would just watch how the plus and minus 5 numbers react with the pivot...I certainly wouldn't let this research keep you out of the short side though...if we go 5 points below the pivot again then my bias is short..
I need to add that the plus and minus 2.5 should be of consideration with this idea..I wouldn't be surprised if we take out the lows that sit at a double bottom ( 5 minute chart and retest the weekly pivot today)..the double bottom is at 61.25...two ticks off the plus 2.5 number...close enough!!
I need to add that the plus and minus 2.5 should be of consideration with this idea..I wouldn't be surprised if we take out the lows that sit at a double bottom ( 5 minute chart and retest the weekly pivot today)..the double bottom is at 61.25...two ticks off the plus 2.5 number...close enough!!
quote:
Originally posted by pips2007
Hello Bruce
1458.00 was hit and upside was 1473 area and then we have come down...close at 1467.75.
Now how do we play the pivot now? Any suggestions? Just need some clarification on your posts....
tks
Absolutely! The past 4 months has enabled me to collect some good data and I will continue to do so. Very good exercise!
Emini Day Trading /
Daily Notes /
Forecast /
Economic Events /
Search /
Terms and Conditions /
Disclaimer /
Books /
Online Books /
Site Map /
Contact /
Privacy Policy /
Links /
About /
Day Trading Forum /
Investment Calculators /
Pivot Point Calculator /
Market Profile Generator /
Fibonacci Calculator /
Mailing List /
Advertise Here /
Articles /
Financial Terms /
Brokers /
Software /
Holidays /
Stock Split Calendar /
Mortgage Calculator /
Donate
Copyright © 2004-2023, MyPivots. All rights reserved.
Copyright © 2004-2023, MyPivots. All rights reserved.