ER2 Day vs Day 3/4 May 2005
Click image for original size
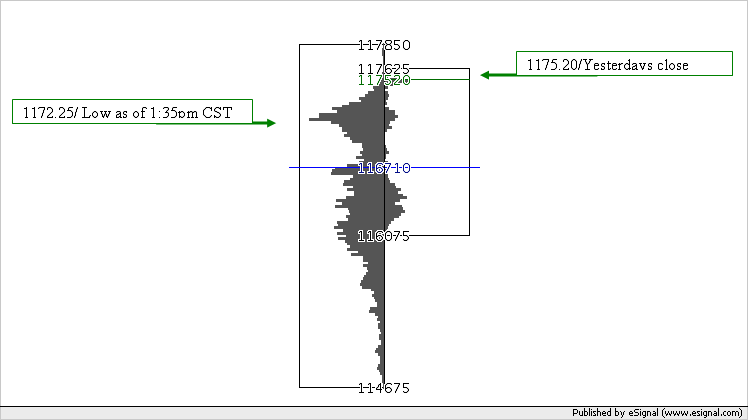
E-MINI RUSSELL 2000 05JUN
CHART-EX DAY VS DAY CHART
MAY 3, 2005 VS. MAY 4, 2005
The above Chart-Ex chart displays the trading ranges and cumulative volume at price for the time frame;
Day = May 3, 2005
Day = May 4, 2005
As of 10:15 am CST, May 5, 2005, the delayed quote for the E-MINI RUSSELL 2000 05JUN is HIGH=599.60, LOW= 593.60, LAST=599.10
The CHART-EX java chart confirms high volume area at 593.60 (today’s low as of 10:15 CST). As you can see from the chart, the e-mini Russell used the base of the first high volume area below 595.00 (yesterday’s close) for its support.
**Traders can use historical data to confirm real time support and resistance numbers**
Emini Day Trading /
Daily Notes /
Forecast /
Economic Events /
Search /
Terms and Conditions /
Disclaimer /
Books /
Online Books /
Site Map /
Contact /
Privacy Policy /
Links /
About /
Day Trading Forum /
Investment Calculators /
Pivot Point Calculator /
Market Profile Generator /
Fibonacci Calculator /
Mailing List /
Advertise Here /
Articles /
Financial Terms /
Brokers /
Software /
Holidays /
Stock Split Calendar /
Mortgage Calculator /
Donate
Copyright © 2004-2023, MyPivots. All rights reserved.
Copyright © 2004-2023, MyPivots. All rights reserved.