constant volume bars and rollover days
Anyone here use constant volume bars? If so, I'm wondering about the distorting effects rollovers have on cvb calculations. i suppose this isn't an issue if you're using a continuous contract symbol for your charting app, but not all data providers/brokers offer continuous contract symbols (IB, for example). So, if you have been charting the March contract, at what point has the volume sufficiently transferred to the June contract to switch one's cvb charts to June? Thanks...
The research that we've done (Rollover Days) show that the soon-to-expire contract trades more volume up to about 9:30am EST on the Rollover day and then volume switches to the new contract. If you page down that article to 10 March 2005 you will see a chart that shows the switch in volume from one contract to another. So based on that you would make the switch at 9:30am EST today.
Excellent article. Thanks for point it out. Still, I saw sharply differing indicator readings this morning, comparing the two contracts. Even now -- at 3:30 NY time -- the two are quite dissmilar. This might have something to do with the lookback periods of the algorithms with which I'm working. I'm using a 6561 CVB on the ES....
Here is a comparison on a Constant Volume Chart of the 2 contracts. The expiring contract H7 is in the top chart and the new contract is in the bottom chart. The reason that the shapes of the charts are different (all other things being equal except the contract) is because of the drop in volume in the old chart. Using your settings of 6561 (which proxies a 2 minute chart) you can see that the expiring contract shows bars from earlier in the day because of the lower volume while the new contract (June 2007) shows bars starting later in the day because of the higher volume which causes more bars to be printed on a chart "per minute".
Click image for original size
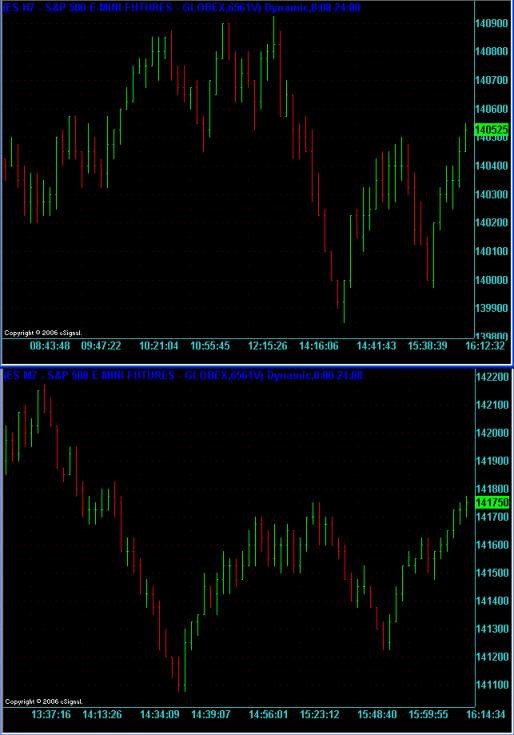
So yes, your indicators will give very different readings because your indicators are "bar" based and the second chart is producing bars that are "more spread out" compared to the first chart. It is clearly demonstrated in the above two charts. What you see on the bottom chart takes up about the right one third (1/3) of the top chart. So if you have an indicator that uses all the visible bars on the chart then there will be very different readings.
This is fascinating, and thanks so much for posting the screen shots. At what point, does the volume on the march contract become so diminimus as to be inconsequential to a constant volume bar chart?
(By the way, I notice that your constant volume bars are generated on an eSignal chart. This is a minor detail, probably, but I gather that eSignal's charting does not offer truly constant volume bars -- e.g., a cvb chart of 1000, may include some bars of, say 1530, if the orders happened to come in that way. In other words, eSignal's chart presents an constant "average" volume bar, rather than a true constant volume bar capped a set amount. I use MultiCharts, which does, in fact, cap its constant volume bars at the specified level. MultiCharts works with a variety of data providers, including eSignal)
(By the way, I notice that your constant volume bars are generated on an eSignal chart. This is a minor detail, probably, but I gather that eSignal's charting does not offer truly constant volume bars -- e.g., a cvb chart of 1000, may include some bars of, say 1530, if the orders happened to come in that way. In other words, eSignal's chart presents an constant "average" volume bar, rather than a true constant volume bar capped a set amount. I use MultiCharts, which does, in fact, cap its constant volume bars at the specified level. MultiCharts works with a variety of data providers, including eSignal)
In my opinion the significant drop-off for volume charts happens at 9:30am EST on Rollover Day. The volume shift to the new contract is so significant that you might as well switch. Those chart images above show how your indicators will be thrown off from then onwards. In fact that is a good argument not to trade at all until the new contract has enough volume bars (from 9:30am onwards) to match the look-back periods/lengths of all the indicators that you use on them.
I'm not sure I understand the difference that you're talking about between eSignal and MultiCharts. From what I have seen, eSignal handles it in the most logical manner. Let's see if I get what you're talking about:
Say we are looking at a 1,000 contract CVB chart. The current bar is represented by 500 contracts and a 1,000 lot order hits the market and is absorbed at a single price. The current bar prints a close at that price and the new bar prints an open at that price and clocks up 500 contracts towards its tally and will move onto a new bar after a further 500 have traded.
You will always have the problem that a number of contracts that go through in one lot will straddle 2 bars and if you are looking at a small volume CVB chart of anything under about 500 contracts then you will sometimes see the same order straddling 3 or more bars.
Yes, you are describing the situation as I understand it. TradeStation also calculates its volume bars in the same manner as eSignal. These volume bars are "averages".
A true "constant volume bar" actually caps the volume at the specified size. So, in the situation you described, with 500 contracts in on a 1000CVB, the 1000 lot order hit, and 500 contracts would be allocated to the bar underformation, which would then be closed, with a new bar opened with 500 bars on the "ledger", if you will. Apparently, MulticCharts is one of the few charting packages that offers volume bars that are truly constant. The difference is subtle, but, to my eyes, unmistakeable -- just a little bit smoother, a little bit "more" of what attracted me to volume bars in the first place.
Since you already have eSignal data, you might want to sign up for the 30 day free trial of MultiCharts and try a side-by-side comparison between constant "average" volume bars and constant "capped" volume bars. I'd be interested to hear your thoughts.
I understand your explanation for calculating the "truly constant" volume bar charts in MultiCharts but I always thought that was the same way that eSignal did it.
So how does eSignal "average" it then if they don't do it in that manner?
So how does eSignal "average" it then if they don't do it in that manner?
Hi -- My understanding is that eSignal's charts function as do TradeStations in this regard, processing volume bars along the lines of the hypothetical example discussed above. As you already have eSignal data, you may wish to run a side-by-side comparison with MultiCharts, which runs off eSignal data (as well as output from a dozen or so other data providers) and offers a 30-day free trial. I'd be interested to hear your thoughts...
quote:
Originally posted by poster
...e.g., a cvb chart of 1000, may include some bars of, say 1530, if the orders happened to come in that way. In other words, eSignal's chart presents an constant "average" volume bar, rather than a true constant volume bar capped a set amount.
I don't think that's how eSignal does it. I think that they use the same method that you described for MultiCharts.
Thanks poster. That seems like the least intuitive way to do it so I wonder how they came up with that idea. I prefer the way that eSignal et al do it.
You said that you use a 6561 Volume chart on the ES. How did you come up with that number? I am guessing that you wanted to proxy a 2 minute chart and so worked out the average number of contracts per minute (or 2 minutes in this case) during RTH. Is that right?
You said that you use a 6561 Volume chart on the ES. How did you come up with that number? I am guessing that you wanted to proxy a 2 minute chart and so worked out the average number of contracts per minute (or 2 minutes in this case) during RTH. Is that right?
Emini Day Trading /
Daily Notes /
Forecast /
Economic Events /
Search /
Terms and Conditions /
Disclaimer /
Books /
Online Books /
Site Map /
Contact /
Privacy Policy /
Links /
About /
Day Trading Forum /
Investment Calculators /
Pivot Point Calculator /
Market Profile Generator /
Fibonacci Calculator /
Mailing List /
Advertise Here /
Articles /
Financial Terms /
Brokers /
Software /
Holidays /
Stock Split Calendar /
Mortgage Calculator /
Donate
Copyright © 2004-2023, MyPivots. All rights reserved.
Copyright © 2004-2023, MyPivots. All rights reserved.