Daily Notes 242
This is the link to the Daily Notes page:
http://www.mypivots.com/DailyNotes/dailynotes.aspx
When they have been updated a reply will be posted to this topic.
Other items of interest may also be posted in the reply to this topic at the same time such as the trading results from live or strategy trading from the previous session.
If you subscribe (free) to this topic then you will receive an email each time a reply is posted here. That way you will know when the Daily Notes have been updated and are ready to read.
To subscribe to this topic:
1. Join this forum (if you are not already a member) by registering (it's free).
2. Now login to the forum.
3. Now subscribe to this topic by clicking the Subscribe to this topic link just below this message.
(If there is no subscribe link below this message then it is because you aren't logged in to the forum. Remember to Register, Confirm you registration by clicking on the link in the email, Login, and then subscribe to the forum.)
Do you have an RSS Reader?
If so, then you don't have to log on to this forum to read the posts. Just hook this forum into your RSS Reader and see anything new that has been posted in your Reader.
More details here: RSS Feed
Daily Notes have been updated.
Transcript from previous trading session's trading room (2 trades lose 0.5 ER2 points)
July’s single print strategy (1 losing trade and 2 winning trades)
(cumulative month's loss: $40)
Transcript from previous trading session's trading room (2 trades lose 0.5 ER2 points)
July’s single print strategy (1 losing trade and 2 winning trades)
(cumulative month's loss: $40)
Daily Notes have been updated.
Transcript from previous trading session's trading room (3 trades lose 1.5 ER2 points)
July’s single print strategy (2 winning trades)
(cumulative month's loss: $570)
Today's comments:
The Daily Notes page shows a very interesting picture today. Compare and contrast the ES and NQ symbols against the YM and ER2 symbols. The first two (ES & NQ) show a normal trading range and a high trend day. The second two (YM & ER2) show a much wider range (as % of their base) and a low trend day.
All 4 are equity index futures and are highly correlated. The difference that you see here reflects the fact that the all sessions data is being used by the YM & ER2 contracts while the RTH session data is being used by the ES & NQ contracts.
Also note the very high range in the QM (Oil contract).
Personal View
The ER2 made a new 10, 20, and 40 day high in the previous session. You can see this if you go into the archives and have a look at the Daily Notes for 7 July 2005 which reflect the stats at the end of 6 July 2005.
The bomb blasts in London shook the market prior to opening and the ER2 market was 17 points below the close at one point and opened with a 7 point gap down. During the trading day yesterday (7 July 2005) the market made a full recovery and in fact closed higher in ALL the index futures markets compared to the previous session.
What does this tell me?
This tells me that even with "special event" disaster news hitting the market we could find no new selling down there. In fact we found plenty of traders taking advantage of what they considered good value prices and bidding the market back up to a higher close.
For me this tells me that we have a strong bull in our midst and the safer side of the market to be on is the long side today.
Remember that this is only my opinion and is only 1 opinion out of millions in the market and it is NOT advice to buy or sell and that trading futures is VERY dangerous.
Daily Notes have been updated.
Transcript from previous trading session's trading room (2 trades make 1.4 ER2 points)
July’s single print strategy (no trades)
Transcript from previous trading session's trading room (2 trades make 1.4 ER2 points)
July’s single print strategy (no trades)
Market Comment for 11 July 2005
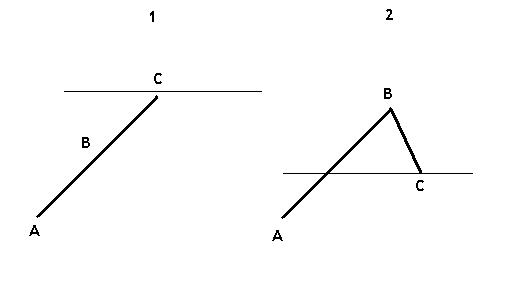
Take a look at the following very simple graphic that I've just drawn:
There are 2 charts and 2 market situations that you can see in chart 1 and 2.
In both charts I assume a new market has started at point A (say the September contract in the ER2) and this market has progressed to point C where the open interest is 10,000 contracts.
Chart 1 closes at the high at point C. Almost every short contract in this market is losing money. So we have 10,000 contracts that are in a losing position.
Chart 2 closes at the midpoint between the up move from A to B and subsequent down move to point C. In this chart/market I am assuming that of the open interest of 10,000 contracts, that all of the longs bought their contracts below point C and all the shorts sold their contracts above point C. (This implies that any longs above point C and any shorts below point C are no longer in the market.)
In chart/market 2 we have perfect equilibrium. Everyone is sitting on a profit and there is little incentive to move the market. The market will be moved by new entrants into the market.
In chart/market 1 we have in-equilibrium. We have half the market holding losing positions and the other half holding winning positions. A situation may develop where shorts wanting to close out their losing positions as soon as possible will be buying the dips. Longs may be holding onto their winning positions and hoping for more upside and more profit. So the shorts will be selling to new entrants into the market. Of course there could also be new entrants into the market that think that this is a top and selling it... Remember that anything can happen.
The reason that I point this out to you now is because the ER2 market is currently making record highs and is showing the signs of a short squeeze which may sustain a rally in the ER2 for a few days. i.e. It is showing the situation that we see in the chart/market 1 shown in the graphic above. All the short contracts are losing money at the moment which is an important consideration if you are thinking of joining them.
I don't have any position on at the moment but will favor the long side in trading today.
Take a look at the following very simple graphic that I've just drawn:
Click image for original size
There are 2 charts and 2 market situations that you can see in chart 1 and 2.
In both charts I assume a new market has started at point A (say the September contract in the ER2) and this market has progressed to point C where the open interest is 10,000 contracts.
Chart 1 closes at the high at point C. Almost every short contract in this market is losing money. So we have 10,000 contracts that are in a losing position.
Chart 2 closes at the midpoint between the up move from A to B and subsequent down move to point C. In this chart/market I am assuming that of the open interest of 10,000 contracts, that all of the longs bought their contracts below point C and all the shorts sold their contracts above point C. (This implies that any longs above point C and any shorts below point C are no longer in the market.)
In chart/market 2 we have perfect equilibrium. Everyone is sitting on a profit and there is little incentive to move the market. The market will be moved by new entrants into the market.
In chart/market 1 we have in-equilibrium. We have half the market holding losing positions and the other half holding winning positions. A situation may develop where shorts wanting to close out their losing positions as soon as possible will be buying the dips. Longs may be holding onto their winning positions and hoping for more upside and more profit. So the shorts will be selling to new entrants into the market. Of course there could also be new entrants into the market that think that this is a top and selling it... Remember that anything can happen.
The reason that I point this out to you now is because the ER2 market is currently making record highs and is showing the signs of a short squeeze which may sustain a rally in the ER2 for a few days. i.e. It is showing the situation that we see in the chart/market 1 shown in the graphic above. All the short contracts are losing money at the moment which is an important consideration if you are thinking of joining them.
I don't have any position on at the moment but will favor the long side in trading today.
Daily Notes have been updated.
Transcript from previous trading session's trading room (2 trades make 2.35 ER2 points)
July’s single print strategy (2 trades made $340)
Transcript from previous trading session's trading room (2 trades make 2.35 ER2 points)
July’s single print strategy (2 trades made $340)
Daily Notes have been updated.
Transcript from previous trading session's trading room (2 trades make 0.7 ER2 points)
July’s single print strategy (1 trade loses $210)
Transcript from previous trading session's trading room (2 trades make 0.7 ER2 points)
July’s single print strategy (1 trade loses $210)
Daily Notes have been updated.
Transcript from previous trading session's trading room (1 trade made 0.5 ER2 points)
July’s single print strategy (1 trade makes $390)
Transcript from previous trading session's trading room (1 trade made 0.5 ER2 points)
July’s single print strategy (1 trade makes $390)
Daily Notes have been updated.
Transcript from previous trading session's trading room (1 trade lost 1.0 ER2 points)
July’s single print strategy (2 trades make $770)
(July cumulative profit is $1,860)
EDIT: Correction made to single prints
Transcript from previous trading session's trading room (1 trade lost 1.0 ER2 points)
July’s single print strategy (2 trades make $770)
(July cumulative profit is $1,860)
EDIT: Correction made to single prints
Daily Notes have been updated.
Transcript from previous trading session's trading room (no trades)
July’s single print strategy (1 trade loses $210)
(July cumulative profit is $1,650)
Transcript from previous trading session's trading room (no trades)
July’s single print strategy (1 trade loses $210)
(July cumulative profit is $1,650)
Daily Notes have been updated.
No transcript from previous trading session's trading room (no trades)
July’s single print strategy (no trades)
(July cumulative profit is $1,650)
No transcript from previous trading session's trading room (no trades)
July’s single print strategy (no trades)
(July cumulative profit is $1,650)
Hey omni
The ER2 and YM don't have gap play figures because they do not have RTH sessions. Of course one could create RTH sessions for them by just looking at the 09:30 to 16:15/17:00 timeframe but the data that I use for those contracts is the all session data.
This has both advantages and disadvantages. The advatages are that you can compare all the averages and summary data between 2 pairs of index futures contracts that are RTH and all sessions. i.e. the NQ and ES are RTH and the YM and ER2 are all sessions. This often gives interesting comparisons at-a-glance as the all session pattern may have been very different to the RTH pattern and this can be quickly picked up in the summary figures, for example the Trend %.
Of course the disadvantage is that you cannot see a gap play figure for the YM and ER2 with this sort of data.
Emini Day Trading /
Daily Notes /
Forecast /
Economic Events /
Search /
Terms and Conditions /
Disclaimer /
Books /
Online Books /
Site Map /
Contact /
Privacy Policy /
Links /
About /
Day Trading Forum /
Investment Calculators /
Pivot Point Calculator /
Market Profile Generator /
Fibonacci Calculator /
Mailing List /
Advertise Here /
Articles /
Financial Terms /
Brokers /
Software /
Holidays /
Stock Split Calendar /
Mortgage Calculator /
Donate
Copyright © 2004-2023, MyPivots. All rights reserved.
Copyright © 2004-2023, MyPivots. All rights reserved.