MACD
How does one qualify whether a MACD crossover has enough momentum to buy or sell the Emini S&P for one point profit
This topic is focused on pre-qualifying the MACD crossover for a 1 point profit with a 1.5 point stop loss in Emini S&P. In my opinion while following this system I will place a market order with the above entry/ exit parameters on seeing the crossover. On several occasions I find that even though I have pre-qualified the crossover yet the market reverses first towards the stop loss and later in the direction I expect it to go. The result is that I am stopped out. Now the question is that whether after the crossover should I wait for an indicator to something specific to make it a more probable trade/ entry point.
quote:
Originally posted by kbi
...several occasions I find that even though I have pre-qualified the crossover yet the market reverses first towards the stop loss and later in the direction I expect it to go. The result is that I am stopped out...
How often does that happen? i.e. Is that in itself a signal that can be traded? Can you enter at the stop (instead) and still target the original target? Or should you consider doubling your position at the stop?
Let me discuss my approach first. I am using a 1 min daily chart. MACD has standard setting of 12/26/9. Stochastic is also of standard setting of 14/2/8. Now I wait for the stochastic crossover below 20 or above 80 to occur and then I focus on the MACD crossover. All trades are taken in the direction indicated by a 10 min. MACD. As the stop loss value is greater than the profit target the overall output is negative. I have tried to decrease the stop loss value but that strangles the trade even more. I have tried this approach also across various time frames but the results haven’t varied. This has lead me to believe that something else should be watched for after the crossover before entering the trade
I think that using a combination of the MACD and Stochastics on a short day trading time frame is probably not a good idea. I think that the combination of these two indicators is probably better suited to longer swing and investment style timeframes. Just my 2 cents.
Well then I am back to square one i.e. trading the MACD crossover in a one min. time frame what do I look out for before entering a market order?
Here is an excellent example of the MACD Kiss pattern.... also added a couple of other notes showing how to profitably trade the MACD...
Click image for original size
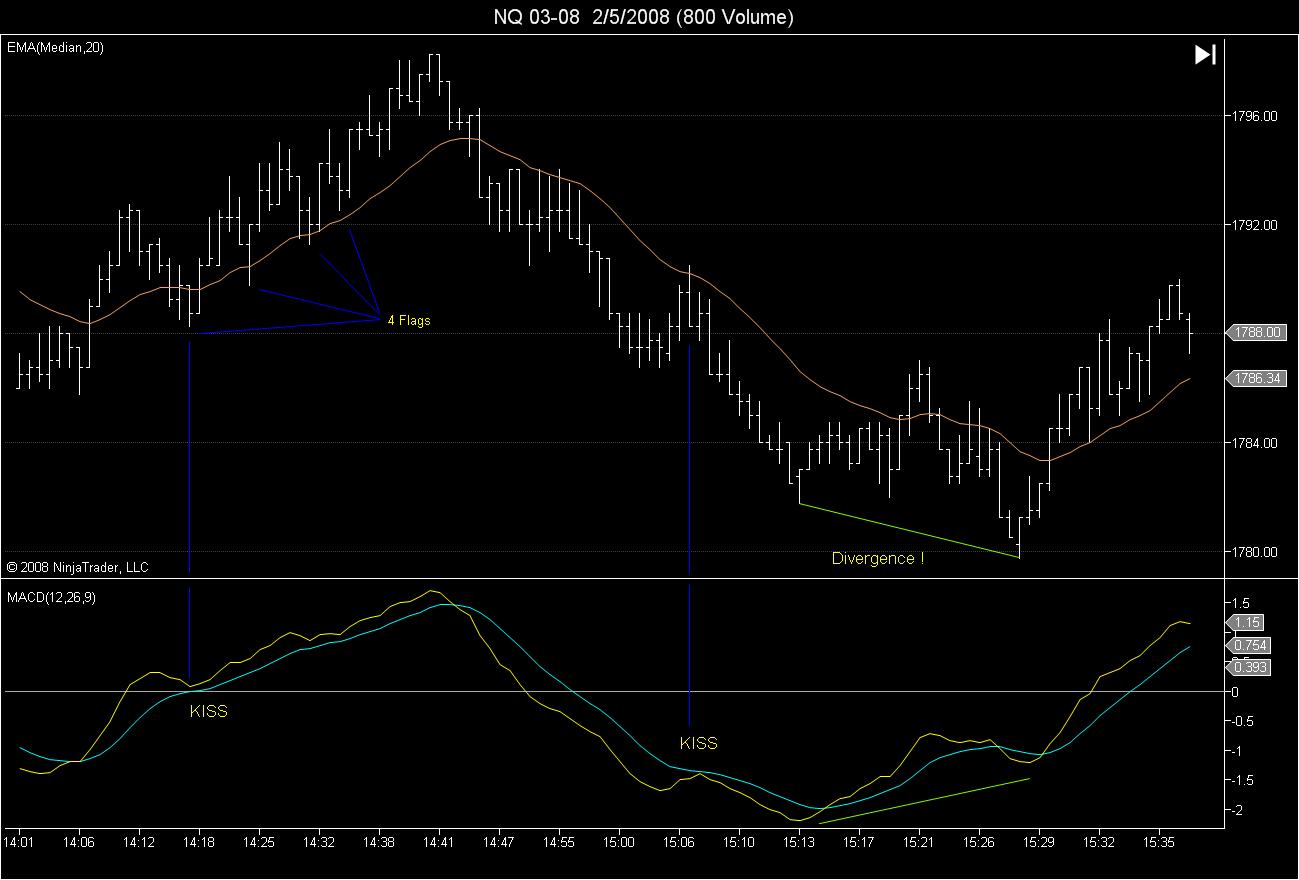
At around 14:43 in the chart when the MACD crossed over, is there any signs that you've seen to warn if it's going to be a kiss or cross? i.e. you could have also gotten long at 14:43 in anticipation of that dip being a long entry point at a potential kiss.
quote:
Originally posted by kbi
Well then I am back to square one i.e. trading the MACD crossover in a one min. time frame what do I look out for before entering a market order?
you are looking at the problem right there, if 1m is still giving you a lagging signal then try 1/2 a minute, 55t, 20t, 100volume, 50v etc...
quote:
Originally posted by day trading
At around 14:43 in the chart when the MACD crossed over, is there any signs that you've seen to warn if it's going to be a kiss or cross? i.e. you could have also gotten long at 14:43 in anticipation of that dip being a long entry point at a potential kiss.
A couple of anecdotal things I can point to, and this is rather arbitrary, is the micro-2T at the 1798.00 level (14:40 on the chart). Also, we are looking at this being the 7th flag in the series, usually after 3 flags I tend to leave the trend alone in terms of adding to or initiating a new position in the trend direction. The 7th flag in a trend is a pretty darn good place to be taking profits
Also, we see in the price action the market tried to turn off the 20 ema and failed causing the MACD to cross down, notice the long bar on the failure down through the ema line. So the long bar failure was the signal a KISS was not going to happen, but unfortunately that is signaled in hindsight. If you had tried to get long on the flag setup in anticipation of the next move to new highs, you would have been stopped out for a loss. If you had waited for some upside confirmation, you probably would have gotten 1 ticked into the long at 1796.25 which as it turns out in hindsight initiated the failure bar.
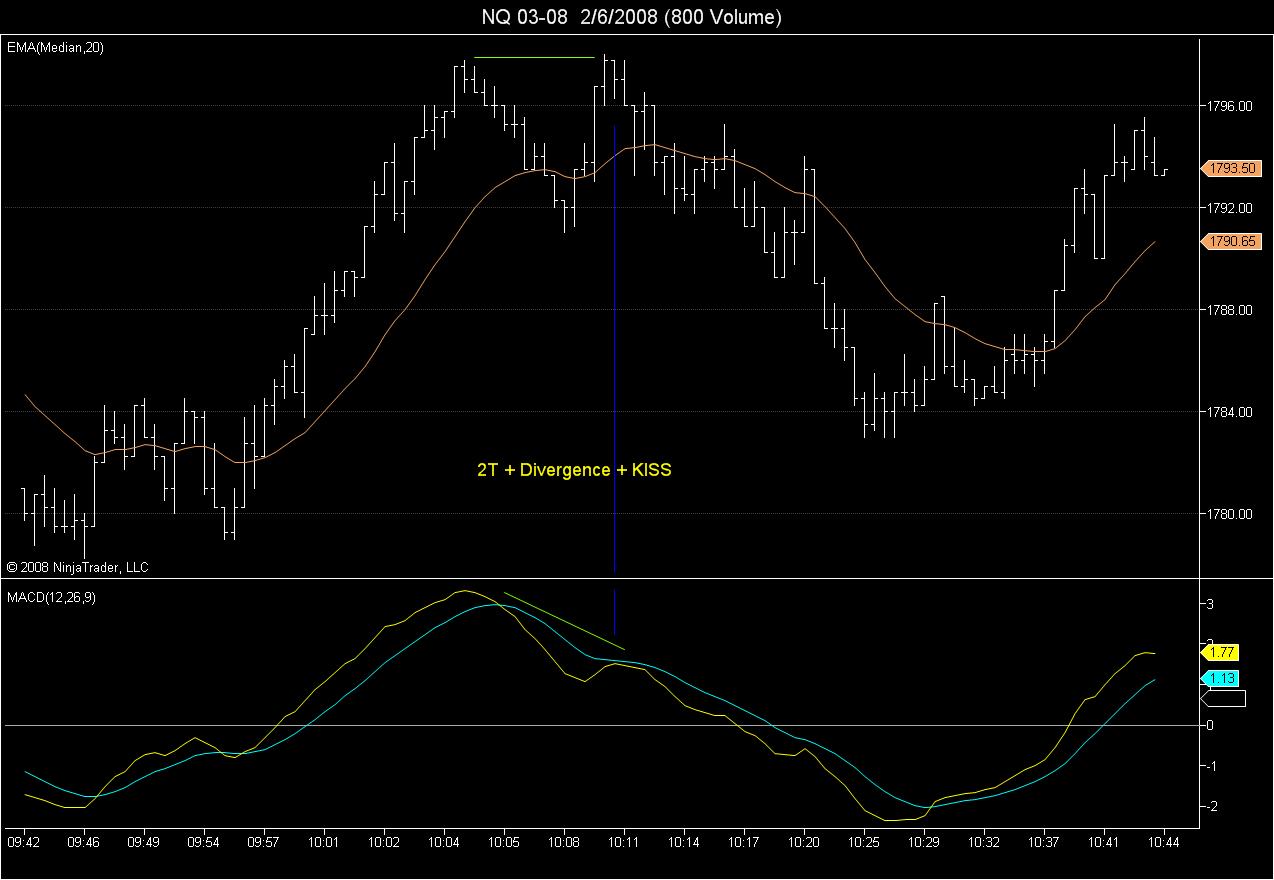
Another Example from this morning...
Price action = double top (aka. 2T ) at the NQ 1798 level
MACD: KISS + Divergence
Click image for original size
Thanks pt - that makes sense.
Emini Day Trading /
Daily Notes /
Forecast /
Economic Events /
Search /
Terms and Conditions /
Disclaimer /
Books /
Online Books /
Site Map /
Contact /
Privacy Policy /
Links /
About /
Day Trading Forum /
Investment Calculators /
Pivot Point Calculator /
Market Profile Generator /
Fibonacci Calculator /
Mailing List /
Advertise Here /
Articles /
Financial Terms /
Brokers /
Software /
Holidays /
Stock Split Calendar /
Mortgage Calculator /
Donate
Copyright © 2004-2023, MyPivots. All rights reserved.
Copyright © 2004-2023, MyPivots. All rights reserved.