Wednesday 12-12-07
Wow..futures up 34 points..in overnight.. I'm a lite seller at 1512.50 trying for those stops at 07.50
trailing stop to 13.5
DT i figured out the chart problem on the forum, I can only see the charts if I am logged in, otherwise they are not visible...
DT i figured out the chart problem on the forum, I can only see the charts if I am logged in, otherwise they are not visible...
price slowly drifting into support levels
trailing stop to 11.0
bit of a long shot, but I am hoping for a break of support and overnight gap fill
trailing stop to 11.0
bit of a long shot, but I am hoping for a break of support and overnight gap fill
way to go pt!!!!!
Could you tell me what specifically you are looking at to determine that the volume is coming back in? Do you use a MA on a certain time frame?
quote:
Originally posted by pt_emini
volume coming back into the markets... trailing stop to 14.5
quote:
Originally posted by pt_emini
DT i figured out the chart problem on the forum, I can only see the charts if I am logged in, otherwise they are not visible...
Thanks for working that out. Hopefully that will get fixed with a new release of the forum software.
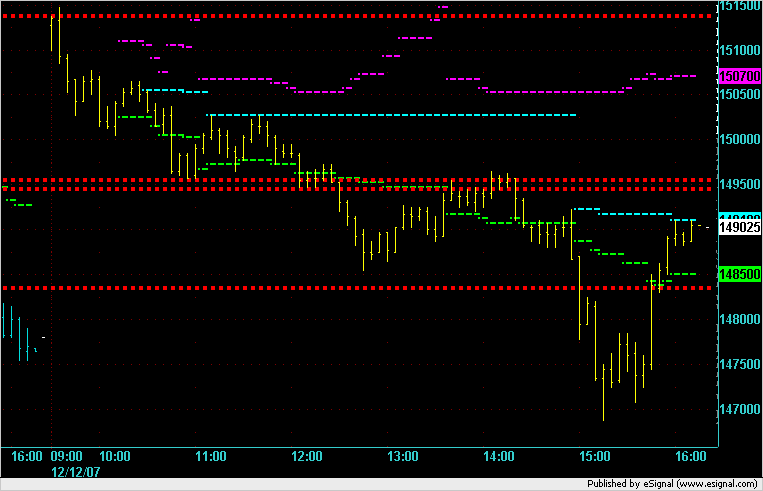
Here's a chart of today's action. The horizontal dashed lines are Single Prints.
Click image for original size
quote:
Originally posted by BruceM
Could you tell me what specifically you are looking at to determine that the volume is coming back in? Do you use a MA on a certain time frame?quote:
Originally posted by pt_emini
volume coming back into the markets... trailing stop to 14.5
Time and Sales
Thanks
quote:
Originally posted by pt_emini
quote:
Originally posted by BruceM
Could you tell me what specifically you are looking at to determine that the volume is coming back in? Do you use a MA on a certain time frame?quote:
Originally posted by pt_emini
volume coming back into the markets... trailing stop to 14.5
Time and Sales
Emini Day Trading /
Daily Notes /
Forecast /
Economic Events /
Search /
Terms and Conditions /
Disclaimer /
Books /
Online Books /
Site Map /
Contact /
Privacy Policy /
Links /
About /
Day Trading Forum /
Investment Calculators /
Pivot Point Calculator /
Market Profile Generator /
Fibonacci Calculator /
Mailing List /
Advertise Here /
Articles /
Financial Terms /
Brokers /
Software /
Holidays /
Stock Split Calendar /
Mortgage Calculator /
Donate
Copyright © 2004-2023, MyPivots. All rights reserved.
Copyright © 2004-2023, MyPivots. All rights reserved.