Wednesday 12-19-07
In Long from 62.50...looking for trade above 71 ...sometime today...lol...then towards the 90's
this a precarious trade location as it falls in between overnight High and low...so higher risk , I'd prefer to get long at lower prices..towards the 56 area
peeled two off at 66.25..,,,3 left now at break even ,,still want that 71 and above area...
now I don't want to stay in if we trade back to 63.75 before 71 trades
nice trade bruce...can you briefly explain why you got long at 62.50? thx
took two off at 73.50 and have one left...will trail keeping 4-5 points off any swing high..if I can get 79 - 80 area then this campaign will be over for me..I'm hoping that "air pocket" between 76 and 80 provides little resistance
interesting inverted head and shoulder if you look at 30 minute overnight chart..which would project this slightly below 1500 for the S&P..puts it up towards weekly pivot...
mistake on post..took one off at 71.25 and one at 73.50...still one left
any chance of you posting a chart on that inverted head and shoulder? if not possible thx anyway
I saw the volume thrust in overnight and we had just tested the Value area low...I was looking to get long at lower prices anyway so but I considered that poor trade location in general...although the trade worked out it wasn't the ULTIMATE...hope that helps..it was basically the pullback after the volume thrust off the VAL...
quote:
Originally posted by gio5959
nice trade bruce...can you briefly explain why you got long at 62.50? thx
flat at 70.75..thoughts turn to which way will hour range be broken
gio5959 also included this information with his email which he kindly said I could post:
quote:
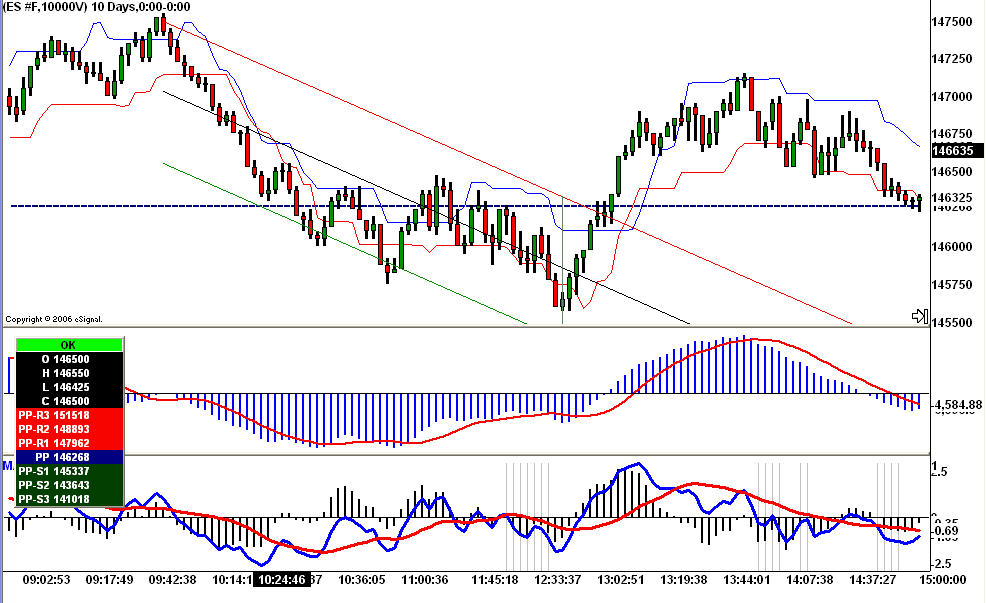
If I use the ES 10k chart I go to edit studies and change the default to triple which would be 9 30 9
I make sure that if I take a 'long' trade that the CO is above it's zero line and vis a vis for a 'short'
This is what I did yesterday;
After price made a structure high I then waited for a structure low...I then anchored the linear regression tool to the msh and msl...that gave me a 'good' place to think about going long...as you can see that at approx 13:08 price broke through the upper linear regression channel and the CO also broke through the zero line...the CO also provided divergence to price...(as you can see I had to wait a long time for the CO to cross it's zero line to take the trade but it was well worth the wait cause I bet the poop out of that trade) :)
The other blue and red lines on the chart are the ChandelierExit EFS...I use that EFS script because it's based on ATR...It also told me that price was now trading above it's ATR and furthered my odds of a good trade
Emini Day Trading /
Daily Notes /
Forecast /
Economic Events /
Search /
Terms and Conditions /
Disclaimer /
Books /
Online Books /
Site Map /
Contact /
Privacy Policy /
Links /
About /
Day Trading Forum /
Investment Calculators /
Pivot Point Calculator /
Market Profile Generator /
Fibonacci Calculator /
Mailing List /
Advertise Here /
Articles /
Financial Terms /
Brokers /
Software /
Holidays /
Stock Split Calendar /
Mortgage Calculator /
Donate
Copyright © 2004-2023, MyPivots. All rights reserved.
Copyright © 2004-2023, MyPivots. All rights reserved.
