Wednesday 12-19-07
In Long from 62.50...looking for trade above 71 ...sometime today...lol...then towards the 90's
here it is...
quote:
Originally posted by gio5959
any chance of you posting a chart on that inverted head and shoulder? if not possible thx anyway
Click image for original size
thanks for the reply, i think i now see what you're saying
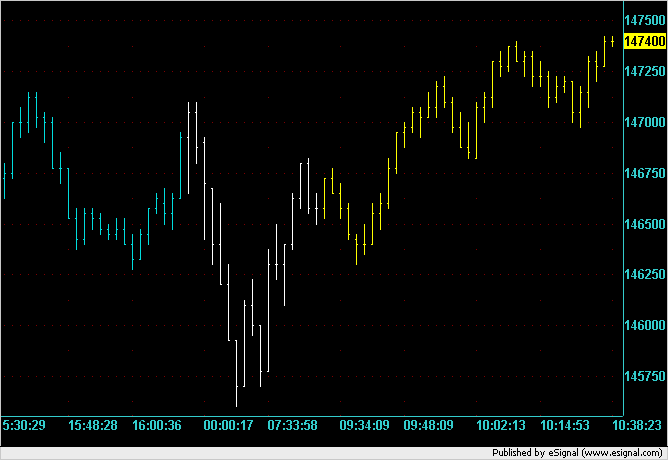
Yesterday end of day, overnight and early morning action shown on a 10,000V chart. The previous day is blue, overnight is white and today is yellow.
Click image for original size
Thanks DT..I like that chart...really makes it easy to "see"
These tests at the 25 and 75 numbers is causing me to think about them as key numbers once again.....initially I looked at the 00, 25 , 50 and 75 numbers about 5 years ago....and determined that for the S&P the 00 and 50 seemed most valid...but I'm noticing that the 25 and 75 come into play more than I give them credit for....perhaps I'll have a friend do some research over the holidays...
Bruce and DT...i took your 10k ES chart and added the chaiken osc to it.
yes the 10k signaled an inverted head/shoulder and at 8:45cst on the neckline break the chaiken also signaled strong volume coming in
i have two chaiken indicators on the same chart. one set to default and one set to triple the default
interesting stuff to say the least
yes the 10k signaled an inverted head/shoulder and at 8:45cst on the neckline break the chaiken also signaled strong volume coming in
i have two chaiken indicators on the same chart. one set to default and one set to triple the default
interesting stuff to say the least
Good trading today Bruce !
Sorry I was unable to join in today, was out most of the day Christmas shopping.
I have also been watching the bottoming formation. Should prove interesting in the day's ahead to see if the market can continue the uptrend away from the recent lows. Strong day today in the T-Notes.
Sorry I was unable to join in today, was out most of the day Christmas shopping.
I have also been watching the bottoming formation. Should prove interesting in the day's ahead to see if the market can continue the uptrend away from the recent lows. Strong day today in the T-Notes.
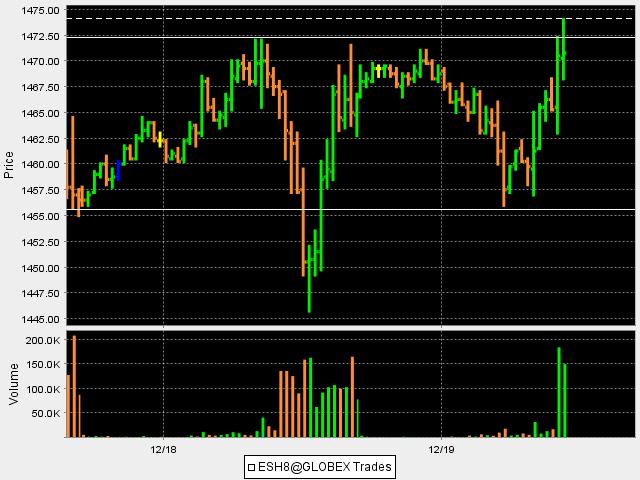
Here's how the day played out in the end. This is an RTH chart so it doesn't show the SHS like the previous chart that I posted which had the overnight.
Click image for original size

quote:
Originally posted by gio5959
Bruce and DT...i took your 10k ES chart and added the chaiken osc to it.
yes the 10k signaled an inverted head/shoulder and at 8:45cst on the neckline break the chaiken also signaled strong volume coming in
i have two chaiken indicators on the same chart. one set to default and one set to triple the default
gio5959: I must confess that I have never heard of the chaiken oscillator. Can you upload an image to show us what it looked like? And perhaps educate us about this oscillator?
Thanks PT and sorry to hear of your computer troubles....
This market is quite compressed and I'm not sure if fading moves will work tomorrow...we may have to put on our breakout shoes....
This market is quite compressed and I'm not sure if fading moves will work tomorrow...we may have to put on our breakout shoes....
quote:
Originally posted by pt_emini
Good trading today Bruce !
Sorry I was unable to join in today, was out most of the day Christmas shopping.
I have also been watching the bottoming formation. Should prove interesting in the day's ahead to see if the market can continue the uptrend away from the recent lows. Strong day today in the T-Notes.
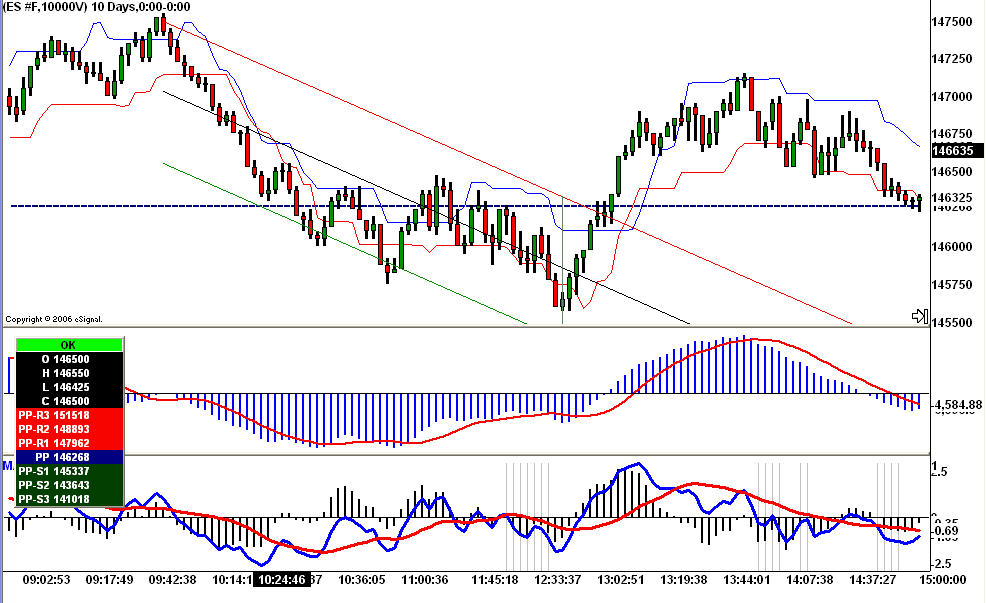
gio5959 also included this information with his email which he kindly said I could post:
quote:
If I use the ES 10k chart I go to edit studies and change the default to triple which would be 9 30 9
I make sure that if I take a 'long' trade that the CO is above it's zero line and vis a vis for a 'short'
This is what I did yesterday;
After price made a structure high I then waited for a structure low...I then anchored the linear regression tool to the msh and msl...that gave me a 'good' place to think about going long...as you can see that at approx 13:08 price broke through the upper linear regression channel and the CO also broke through the zero line...the CO also provided divergence to price...(as you can see I had to wait a long time for the CO to cross it's zero line to take the trade but it was well worth the wait cause I bet the poop out of that trade) :)
The other blue and red lines on the chart are the ChandelierExit EFS...I use that EFS script because it's based on ATR...It also told me that price was now trading above it's ATR and furthered my odds of a good trade
Click image for original size
Emini Day Trading /
Daily Notes /
Forecast /
Economic Events /
Search /
Terms and Conditions /
Disclaimer /
Books /
Online Books /
Site Map /
Contact /
Privacy Policy /
Links /
About /
Day Trading Forum /
Investment Calculators /
Pivot Point Calculator /
Market Profile Generator /
Fibonacci Calculator /
Mailing List /
Advertise Here /
Articles /
Financial Terms /
Brokers /
Software /
Holidays /
Stock Split Calendar /
Mortgage Calculator /
Donate
Copyright © 2004-2023, MyPivots. All rights reserved.
Copyright © 2004-2023, MyPivots. All rights reserved.