Wednesday 12-19-07
In Long from 62.50...looking for trade above 71 ...sometime today...lol...then towards the 90's
quote:
Originally posted by day trading
quote:
Originally posted by gio5959
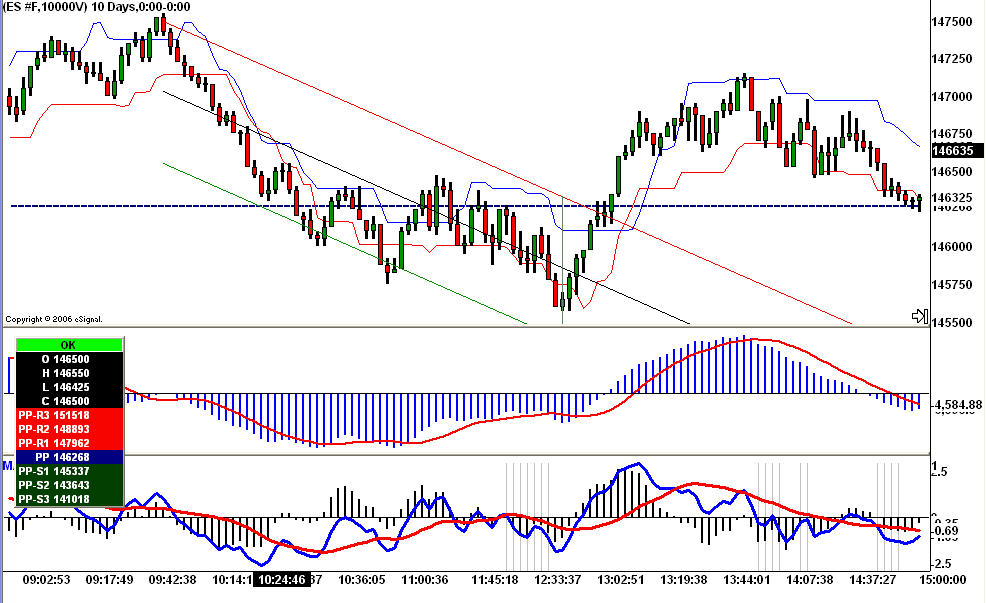
Bruce and DT...i took your 10k ES chart and added the chaiken osc to it.
yes the 10k signaled an inverted head/shoulder and at 8:45cst on the neckline break the chaiken also signaled strong volume coming in
i have two chaiken indicators on the same chart. one set to default and one set to triple the default
gio5959: I must confess that I have never heard of the chaiken oscillator. Can you upload an image to show us what it looked like? And perhaps educate us about this oscillator?
[file]10k_ES.jpg,126,,0[/file]
I hope I uploaded the pic successfully...
you will have to google for the math behind the Chaiken but in short it's all about money flowing in to or out of the market
The first subwindow is the Chaiken Osc at the default setting of 3 10 3 and the second subwindow is the triple Chaiken
Now, if you use Bruce's theory of the MACD Kiss and apply it to the Chaiken Osc you will see how the money was flowing in to the market as Bruce took the long trade off the inverted head and shoulder this morning.
If you use Esignal I will glady send you the EFS or it can found at Esignal fileshare. I use the one with the Moving Average
Huge odds the trade would work IMO
geez , i guess i musta hit the button three times
first time i've downloaded a pic here
sorry bout that lol
first time i've downloaded a pic here
sorry bout that lol
quote:
Originally posted by gio5959
geez , i guess i musta hit the button three times
first time i've downloaded a pic here
sorry bout that lol
You only uploaded it once but referenced it 3 times. I removed the other 2 references to the chart so your post looks a bit better now.
quote:
Originally posted by gio5959
...If you use Esignal I will glady send you the EFS or it can found at Esignal fileshare. I use the one with the Moving Average
Can you put the EFS in a zip and upload it to this thread? That will stop everyone asking each other if it can be emailed etc. as then everyone will be able to just download it here right away. Thanks!
quote:I dont know how to put the EFS in a zip file. If you give me the steps I will try doing that Thx
Can you put the EFS in a zip and upload it to this thread? That will stop everyone asking each other if it can be emailed etc. as then everyone will be able to just download it here right away. Thanks!
quote:
Originally posted by gio5959
quote:
Can you put the EFS in a zip and upload it to this thread? That will stop everyone asking each other if it can be emailed etc. as then everyone will be able to just download it here right away. Thanks!
I dont know how to put the EFS in a zip file. If you give me the steps I will try doing that Thx
Or, I can email it to you and you can put it on a zip and post here?
I've sent you an email. You can just attach the EFS in the reply. Thanks.
Here is the Chaiken Oscillator for eSignal discussed earlier in this thread. In the following post I'll post the body of the EFS in case anybody wants to copy/past it into an EFS to use.
Click link to access uploaded file:
MAofChaikinOscillator.zip
MAofChaikinOscillator.zip
/*********************************************************

Alexis C. Montenegro © January 2006

Use and/or modify this code freely. If you redistribute it

please include this and/or any other comment blocks and a

description of any changes you make.

**********************************************************/


var fpArray = new Array();


function preMain() {

    setStudyTitle("MA of Chaikin Oscillator");

    setCursorLabelName("CO", 0);

    setCursorLabelName("MAofCO", 1);

    setDefaultBarFgColor(Color.blue, 0);

    setDefaultBarFgColor(Color.red, 1);

    setDefaultBarThickness(2,0);

    setDefaultBarThickness(2,1);


	var x=0;

    fpArray[x] = new FunctionParameter("Fast", FunctionParameter.NUMBER);

	with(fpArray[x++]){

        setLowerLimit(1);

        setDefault(3);

    }

    fpArray[x] = new FunctionParameter("Slow", FunctionParameter.NUMBER);

	with(fpArray[x++]){

        setLowerLimit(1);

        setDefault(10);

    }

    fpArray[x] = new FunctionParameter("MAType", FunctionParameter.STRING);

    with(fpArray[x++]){

        addOption("sma");

        addOption("ema");

        addOption("wma");

        setDefault("sma");

    }

    fpArray[x] = new FunctionParameter("MALength", FunctionParameter.NUMBER);

	with(fpArray[x++]){

        setLowerLimit(1);

        setDefault(3);

    }

    fpArray[x] = new FunctionParameter("Symbol", FunctionParameter.STRING);

    with(fpArray[x++]){

        setDefault();

	}

	fpArray[x] = new FunctionParameter("Interval", FunctionParameter.STRING);

	with(fpArray[x++]){

        setDefault();

    }

    fpArray[x] = new FunctionParameter("Hist", FunctionParameter.BOOLEAN);

	with(fpArray[x++]){

        setName("Plot as Histogram");

        setDefault(false);

    }

    fpArray[x] = new FunctionParameter("Params", FunctionParameter.BOOLEAN);

	with(fpArray[x++]){

        setName("Show Parameters");

        setDefault(false);

    }

}


var bInit = false;

var xCOsc  = null;

var xMAofCOsc = null;


function main(Fast,Slow,MAType,MALength,Symbol,Interval,Hist,Params) {


    if(bInit == false){

        if(Symbol == null) Symbol = getSymbol();

        if(Interval == null) Interval = getInterval();

        var vSymbol = Symbol+","+Interval;

        xCOsc = efsInternal("calcCOsc",Fast,Slow,(sym(vSymbol)));

        xMAofCOsc = eval(MAType)(MALength,xCOsc);

        if(Hist == true) setPlotType(PLOTTYPE_HISTOGRAM,0);

        addBand(0, PS_SOLID, 1, Color.black,"0");

        setShowTitleParameters(eval(Params));

        bInit = true;

    }


    return new Array (getSeries(xCOsc),getSeries(xMAofCOsc));

}


var xInit = false;

var xFast = null;

var xSlow  = null;


function calcCOsc(fast,slow,source){

    if(xInit == false){

        xFast = ema(fast,accDist());

        xSlow = ema(slow,accDist());

        xInit = true;

    }

    if(getCurrentBarCount()<slow) return;

	return (xFast.getValue(0)-xSlow.getValue(0));

}
gio5959 also included this information with his email which he kindly said I could post:
quote:
If I use the ES 10k chart I go to edit studies and change the default to triple which would be 9 30 9
I make sure that if I take a 'long' trade that the CO is above it's zero line and vis a vis for a 'short'
This is what I did yesterday;
After price made a structure high I then waited for a structure low...I then anchored the linear regression tool to the msh and msl...that gave me a 'good' place to think about going long...as you can see that at approx 13:08 price broke through the upper linear regression channel and the CO also broke through the zero line...the CO also provided divergence to price...(as you can see I had to wait a long time for the CO to cross it's zero line to take the trade but it was well worth the wait cause I bet the poop out of that trade) :)
The other blue and red lines on the chart are the ChandelierExit EFS...I use that EFS script because it's based on ATR...It also told me that price was now trading above it's ATR and furthered my odds of a good trade
Click image for original size
Emini Day Trading /
Daily Notes /
Forecast /
Economic Events /
Search /
Terms and Conditions /
Disclaimer /
Books /
Online Books /
Site Map /
Contact /
Privacy Policy /
Links /
About /
Day Trading Forum /
Investment Calculators /
Pivot Point Calculator /
Market Profile Generator /
Fibonacci Calculator /
Mailing List /
Advertise Here /
Articles /
Financial Terms /
Brokers /
Software /
Holidays /
Stock Split Calendar /
Mortgage Calculator /
Donate
Copyright © 2004-2023, MyPivots. All rights reserved.
Copyright © 2004-2023, MyPivots. All rights reserved.