8 May 2005 (Wednesday)
Session Start: Wed Jun 08 07:49:04 2005
Session Ident: #T1
[09:04:05] <mikee> gm, 1203.5 is 50% (1209.75-1197.5) and 68% (1209.75-1193), next upside 1195, downside - 1201.5
[09:04:55] <mikee> er=625.2
[09:30:58] <guy> gm and gl everyone
[09:31:11] <guy> Yest. singles immediately filled on ER2 and ES
[09:33:54] <tuna> dont see that
[09:36:09] <guy> Here is the ER2 chart
[09:36:19] <guy> tuna: Q bracket yest
[09:36:20] <signal>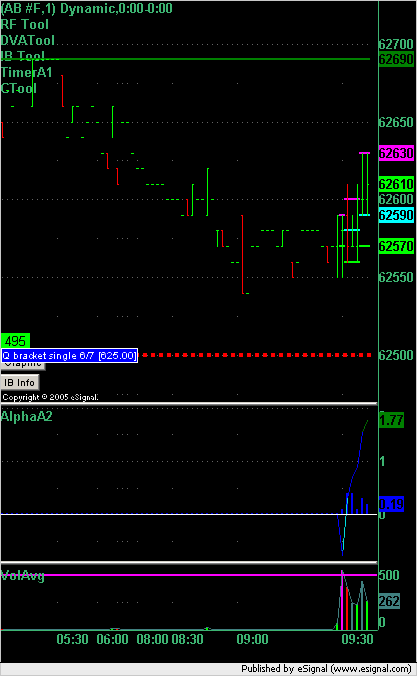
[09:36:28] <guy> were those not singles?
[09:36:55] <guy> so because we opened above them (they were singles above us at close yesterday) the immediately cancel/fill
[09:37:09] <guy> ...they immediately...
[09:39:33] <tuna> oh
[09:39:59] <tuna> i understand
[09:42:09] <guy> Buys ER2 @ 624.8
[09:42:29] <guy> This is a pure alpha trade
[09:42:40] <signal>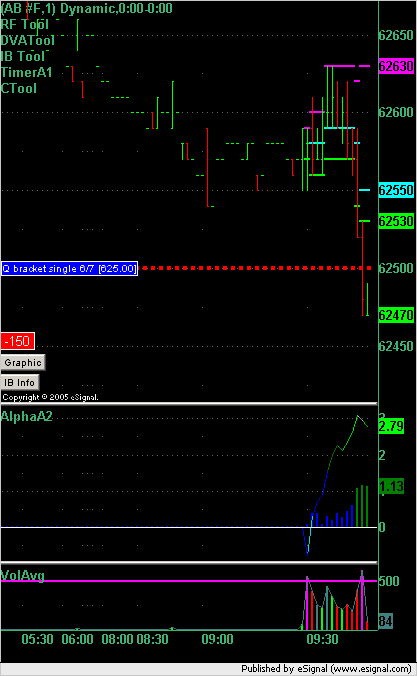
[09:42:57] <guy> hoping to get a buffer before economic numbers out....
[09:48:41] <guy> Wholesale Trade
[09:48:41] <guy> 10:00 ET
[09:48:41] <guy> EIA Petroleum Status Report
[09:48:41] <guy> 10:30 ET
[09:49:52] <guy> Exited all Long ER2 at 625.1 --> + 0.3
[09:50:00] <guy> i'll wait for news now....
[09:57:09] <guy> well that was the buffer i was hoping for... i'm just trying to work out why I exited that trade...
[09:57:59] <guy> Wholesale Trade
[09:57:59] <guy> 10:00 ET
[09:57:59] <guy> EIA Petroleum Status Report
[09:57:59] <guy> 10:30 ET
[10:12:46] <guy> oil is moving up 18 minutes before oil report
[10:19:10] <guy> EIA Petroleum Status Report 10:30 ET
[10:22:29] <guy> ER2 chart now
[10:22:35] <guy> alpha indicating long
[10:22:40] <signal>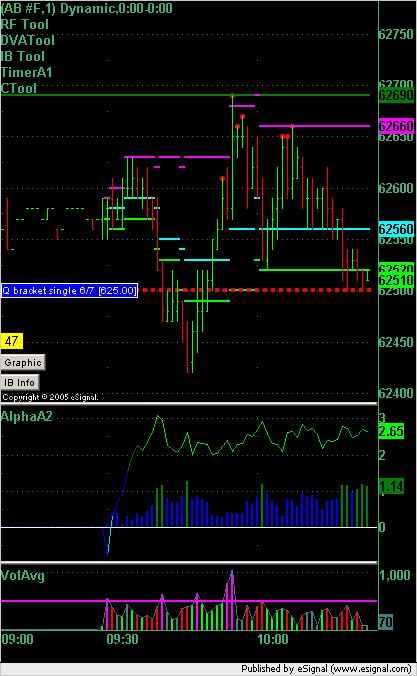
[10:23:00] <guy> red line is filled single - i could switch that off but i like to see filled singles during the day
[10:23:15] <guy> ER2 reversed at VAL
[10:25:55] <guy> While we're waiting for the oil report to come out let me show you the latest tool from the ToolPack
[10:26:11] <guy> If you're into Fibonacci levels
[10:26:17] <guy> then this may interest you
[10:26:18] <signal>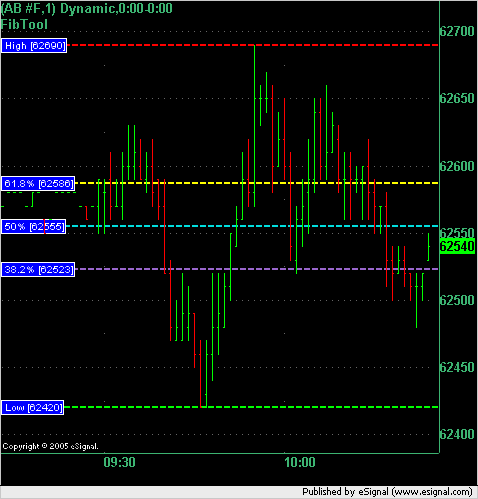
[10:26:44] <guy> The retracements are automatically adjusted as the high and low change
[10:27:11] <guy> you can also change the % values you watch to say 25% and 75% (any value) instead of the defaults
[10:27:57] <guy> I haven't worked much with fib numbers but I intend to load this up every now and then and see how well the levels are working...
[11:01:51] <signal>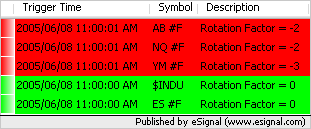
[11:07:14] <guy> last posting was the rotation factor image
[11:10:09] <guy> okay i'm looking to the DVAL with IBL here for a long...
[11:10:24] <guy> here is the chart i'm looking at
[11:10:35] <signal>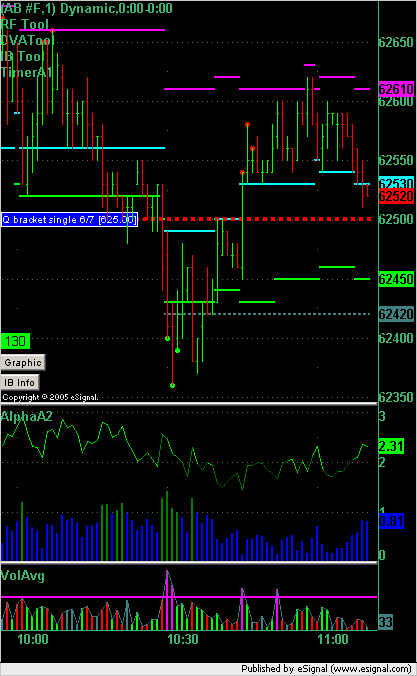
[11:12:54] <guy> i'm not going to use limit orders because I will probably still want to enter on a spike down and get a better price
[12:08:46] <guy> Visualizing the Worst Case Scenario
[12:30:37] <guy> rotation factors:
[12:30:48] <signal>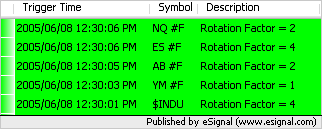
[13:00:23] <tuna> guy it looks like paltalk has been hijacked
[13:05:59] <guy_afk> hey tuna: is paltalk back?
[13:06:11] <tuna> no
[13:06:29] <guy_afk> i'm surprised that there is only 1 person in the backup irc room
[13:06:30] <tuna> all of paltalk was hijacked
[13:06:33] <guy_afk> wow
[13:10:30] <tuna> backup irc room?
[13:14:00] <guy> #jpjtrading
[13:17:42] <gloveday> paltalk is back
[13:18:28] <guy> thx gloveday
[13:19:20] <gloveday> yw
[13:19:50] <guy> i'm having problems with esignal and chat so can't post chart atm
[13:23:44] <tuna> nah were all still red dotted
[15:08:02] <guy> Okay ER2 chart to now
[15:08:12] <signal>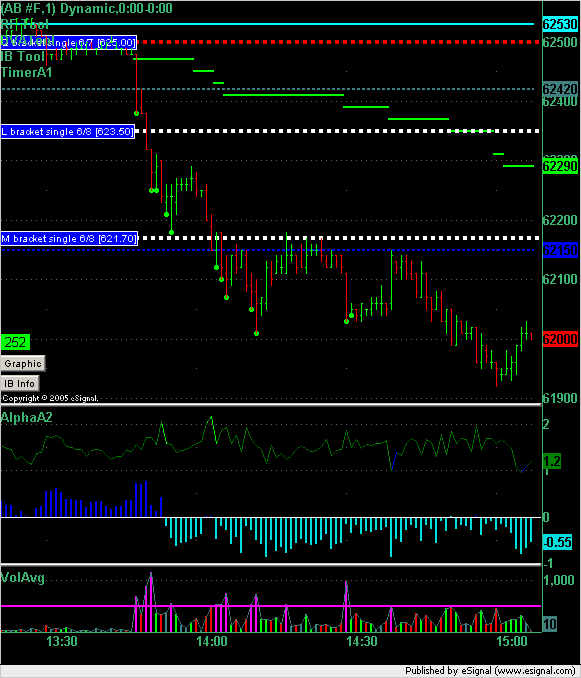
[15:08:31] <guy> At 13:54 alpha switched from buy mode to sell mode
[15:08:43] <guy> fspec: you were asking about this yesterday i believe[15:08:58] <guy> on that chart you can also see 2 confirmed singles above us
[15:09:06] <guy> and 1 filled single
[15:09:54] <guy> the filled single happened as the market opened because it was an "upper" single and the market opened above it so it immediately filled beyond its price and so was immediately invalidated
[15:10:35] <guy> TimerA1 is the indicator that's putting the green buy dots on the chart
[15:10:48] <guy> and it is set to 10% and 800/-800 as the extremes
[15:11:19] <guy> that means that it will put a green/red dot on a bar if $tick touches within the 10th percentile of its range
[15:11:30] <guy> and if $tick is above/below 800/-800
[15:13:38] <guy> .
[15:13:53] <guy> we know that the market often overshoots and when it does it retraces
[15:14:28] <guy> we want to isolate possible areas where the market has overshot and if we are enter a counter trend trade we want to enter in the safest
[15:14:41] <guy> possible area which is often one where there market has overshot
[15:15:20] <guy> .
[15:15:33] <signal>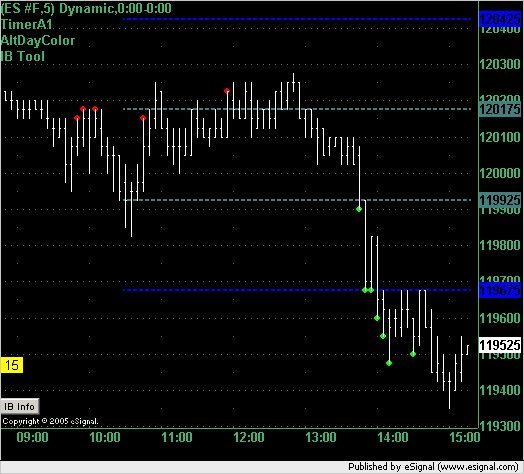
[15:15:34] <guy> Here is a 5min ES bar chart for today so far
[15:16:13] <guy> i have colored it white in order to highlight the TimerA1 indicators
[15:16:34] <guy> you can see that TimerA1 "called" shorts at 3 different points today
[15:16:54] <guy> (the settings are 10%/800/-800
[15:17:36] <guy> TimerA1 is not an indicator by itself but you will notice that at the extreme moves there is most often a red or green dot on the bar
[15:17:51] <guy> it is another confirming indicator in the many tools that you can use
[15:18:15] <guy> you can (as an alternative) watch the $tick chart and move lines that show you the 10th percentile cutoff
[15:18:48] <guy> all that TimerA1 is doing here is making your decision easier and quicker by putting that information right next to the bars and prices that you are watching
[15:19:13] <guy> so you know what $tick is doing relative to its moves so far during the day
[15:49:21] <guy> Mikee - have a look at this chart
[15:49:23] <signal>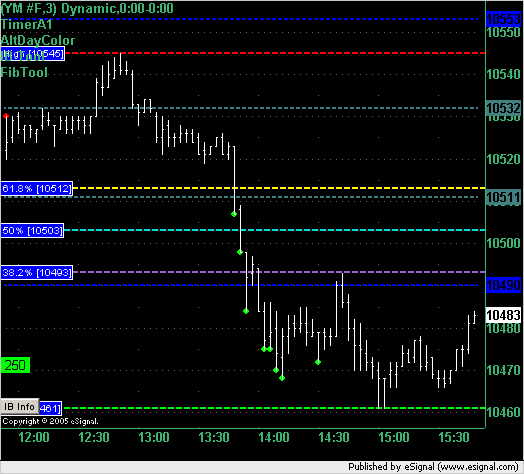
[16:25:51] <guy> Don't forget that tomorrow is rollover day ( Rollover ) on the CME index futures. The contract letter will change from M to U.
[16:29:57] <guy> good night all[/img]Session Close: Wed Jun 08 16:30:11 2005
Emini Day Trading /
Daily Notes /
Forecast /
Economic Events /
Search /
Terms and Conditions /
Disclaimer /
Books /
Online Books /
Site Map /
Contact /
Privacy Policy /
Links /
About /
Day Trading Forum /
Investment Calculators /
Pivot Point Calculator /
Market Profile Generator /
Fibonacci Calculator /
Mailing List /
Advertise Here /
Articles /
Financial Terms /
Brokers /
Software /
Holidays /
Stock Split Calendar /
Mortgage Calculator /
Donate
Copyright © 2004-2023, MyPivots. All rights reserved.
Copyright © 2004-2023, MyPivots. All rights reserved.