Efficient Markets
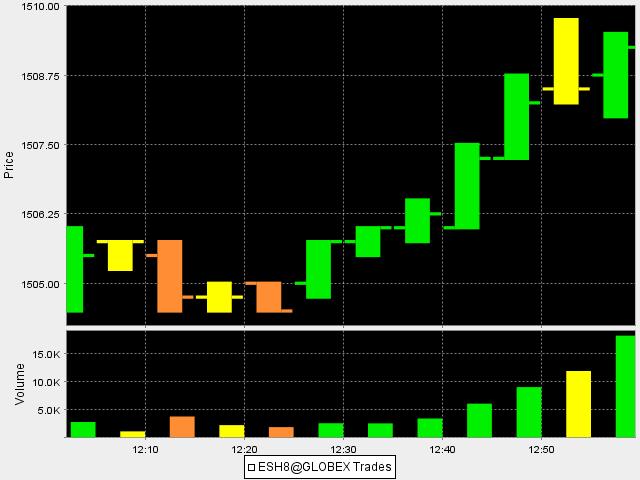
Look at the gap on this 5 minute RTH chart of the S&P...just below 1505 at 1504.50...note the triples also....The market will find a way to "fill in" these holes in the charts.....After being "filled in" in the overnight session this same point became initial resistance in the day session the following trading day...these holes will occur sometimes in low volume trading
Click image for original size
last and final add - on came in at 92.75..trying to get 96.25 ..this is poor trading and goes to show that trading and entertaining family just don't mix...triples very far off...critical mistake for me was not covering at the 95
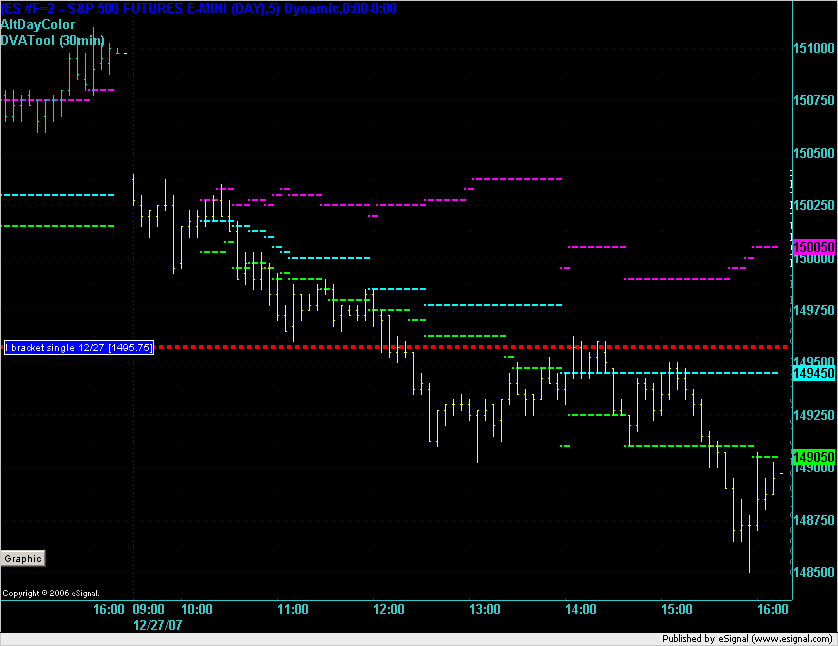
reason 95 was important is because of the window theory and the key number...so we have key of 1500 so if we trade to 1495 then that eliminates long side around key number and further downside.....in theory..the other reason is weekly pivot still sits below down at 1480.....triples are good targets but you still need good entries....thanks for reverse dragon Gio
If this ABC pattern is not violated maybe its the ticket that takes us to 1500 ?
[file]ES_abc.jpg,126,,0[/file]
[file]ES_abc.jpg,126,,0[/file]
Hope you fellows did better than me today
I was in the green at first but then kept fighting the stuff i normally look at, and the trend, and got a nice hair cut
I was in the green at first but then kept fighting the stuff i normally look at, and the trend, and got a nice hair cut
I was looking at the single prints at 1496.25 as mentioned for that add on target so I will consider today a lucky day...especially considering that the triples failed......sorry for you hair cut but you'll get em back tomorrow...
quote:
Originally posted by gio5959
Hope you fellows did better than me today
I was in the green at first but then kept fighting the stuff i normally look at, and the trend, and got a nice hair cut
Emini Day Trading /
Daily Notes /
Forecast /
Economic Events /
Search /
Terms and Conditions /
Disclaimer /
Books /
Online Books /
Site Map /
Contact /
Privacy Policy /
Links /
About /
Day Trading Forum /
Investment Calculators /
Pivot Point Calculator /
Market Profile Generator /
Fibonacci Calculator /
Mailing List /
Advertise Here /
Articles /
Financial Terms /
Brokers /
Software /
Holidays /
Stock Split Calendar /
Mortgage Calculator /
Donate
Copyright © 2004-2023, MyPivots. All rights reserved.
Copyright © 2004-2023, MyPivots. All rights reserved.