Friday 12-28-07
If I had a scenario that I would like to see played out in tomorrows session it would be the following:
These higher prices in overnight ( up at 94.25 as I type)will be met with selling to drive the market down to weekly pivot at 1481..then buying to take over to upside in the 1475 - 1481 area...
on any lower open I'd like to see an initial drive down to be met with buying...
I'm also looking for two sided trade off the open price...so initial push down will trade back through the open on upside and / or an initial push up will trade back down....I am biased to upside in general....
Too much Rum Egg Nog tonight....predicting is fun...sometimes....but actually it's my basic plan...there are those who can be like a reed in the wind and "listen" to the message of the market very well. I am not one of them...I set up " If , then, Else" scenarios ahead of time....a spill over from my days as a programmer
Im counting on you mr. ugly dragon
[file]ES_12_28_07_pic3.jpg,126,,0[/file]
[file]ES_12_28_07_pic3.jpg,126,,0[/file]
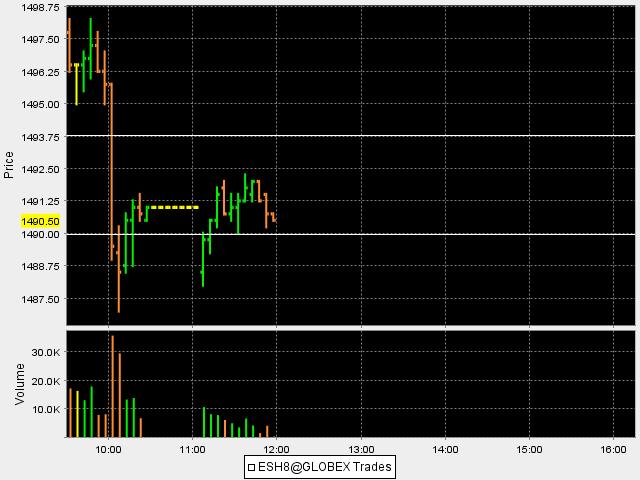
cleared all at 91.50...a lucky trade and having data problems and seeing the triples made me cover into that "air pocket"...going away to Ski a few days...I'll have some questions for ya gio when I get back.....here is screen shot of data problems so any newbie can see additopnal challenges we face at times...
Click image for original size
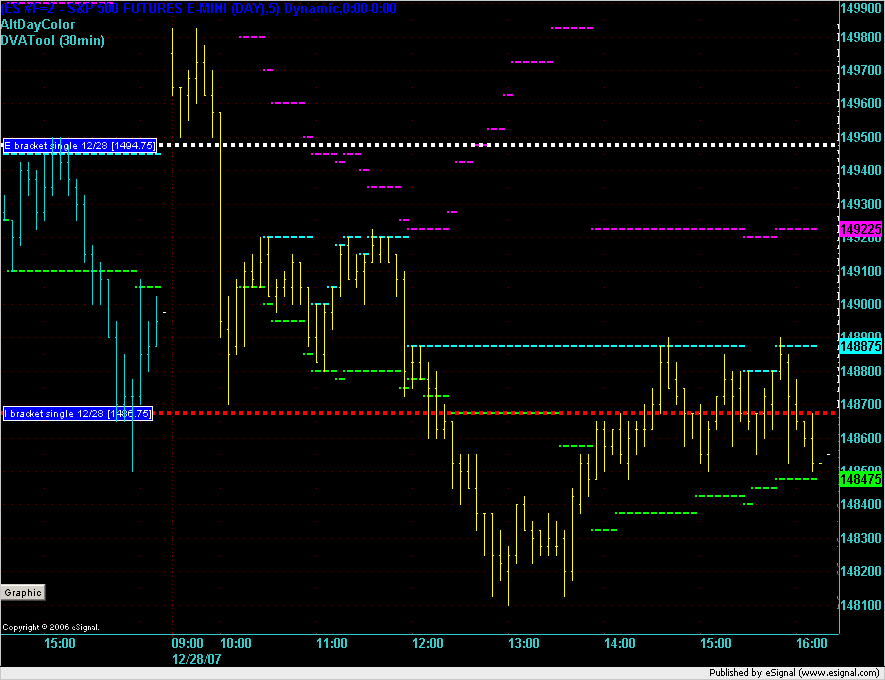
This ugly dragon needs to reverse here at the 1486.50/1485.50 area or its invalid
and, I give back my gains from this morn. dangit !
[file]ES_12_28_07_pic4.jpg,126,,0[/file]
and, I give back my gains from this morn. dangit !
[file]ES_12_28_07_pic4.jpg,126,,0[/file]
quote:
Originally posted by BruceM
I'll have some questions for ya gio when I get back.....
Have a good time...I'm still in this hummer trade but it's looking bad..good thing I didnt bet the farm
I'd love to see 1495.00 but maybe it's too late in the day for that
[file]ES_12_28_07_pic5.jpg,126,,0[/file]
[file]ES_12_28_07_pic5.jpg,126,,0[/file]
The charts/image attachments that are uploaded can't be viewed. All that I see is a small box at the left bottom corner with an "X". When I right click on it to 'show picture" it doesn't work. Please advice?
quote:
Originally posted by kbi
The charts/image attachments that are uploaded can't be viewed. All that I see is a small box at the left bottom corner with an "X". When I right click on it to 'show picture" it doesn't work. Please advice?
Can you see them when you're logged in to the forum?
I think that one of the problems is that the images default to "hidden" when uploaded which should mean that you can see them when you're logged in.
Let me know if logging in solves the problem...
Thanks it solved my problem. What time is being used? 1min, 5 min.....
I'm not sure about Bruce's charts but Gio's charts are 3 and 5 minute charts. If you look in the top left corner of Gio's charts you will see that it says (ES #F=2,3) or (ES #F=2,5). The figure after the comma shows that it's a 3 or 5 minute chart. The other parts, in case you're interested show:
ES: Emini S&P500
#F: Continuous contract (this will be H8 now)
=2: RTH session only
,3: 3 minute chart
ES: Emini S&P500
#F: Continuous contract (this will be H8 now)
=2: RTH session only
,3: 3 minute chart
I'm just about out of rum egg - nog but I gotta pat myself on the back for this one......they nailed that 1481 number to the tick...clearing out some triples along the way...I missed it but would have rather been on the slopes anyway.......the 1481 was the weekly pivot...
quote:
Originally posted by BruceM
These higher prices in overnight ( up at 94.25 as I type)will be met with selling to drive the market down to weekly pivot at 1481..then buying to take over to upside in the 1475 - 1481 area...
Emini Day Trading /
Daily Notes /
Forecast /
Economic Events /
Search /
Terms and Conditions /
Disclaimer /
Books /
Online Books /
Site Map /
Contact /
Privacy Policy /
Links /
About /
Day Trading Forum /
Investment Calculators /
Pivot Point Calculator /
Market Profile Generator /
Fibonacci Calculator /
Mailing List /
Advertise Here /
Articles /
Financial Terms /
Brokers /
Software /
Holidays /
Stock Split Calendar /
Mortgage Calculator /
Donate
Copyright © 2004-2023, MyPivots. All rights reserved.
Copyright © 2004-2023, MyPivots. All rights reserved.