Market Map
I used alt-printscrn to capture my daily intraday predicts+actual SP plot and then the windows accessory "paint" to paste the clipboard results and then saved my very first gif file a little while ago.
Below chart shows my own predictor program NAILED the intraday movement of SP index on monday 31 dec and goes a long way in confirming that price movement can be VALIDLY predicted using historical data (at least it was monday)..
dave in cocoa beach florida
Below chart shows my own predictor program NAILED the intraday movement of SP index on monday 31 dec and goes a long way in confirming that price movement can be VALIDLY predicted using historical data (at least it was monday)..
Click image for original size
dave in cocoa beach florida
Hmmm, so far I'm batting 00 in 08
In the future,
I will refrain from posting any day hilo time prediction thats showing a trade window less that 5 hrs. I expect that will limit my predict charts to about 1/week. Hopefully that will raise my batting average.
In the future,
I will refrain from posting any day hilo time prediction thats showing a trade window less that 5 hrs. I expect that will limit my predict charts to about 1/week. Hopefully that will raise my batting average.
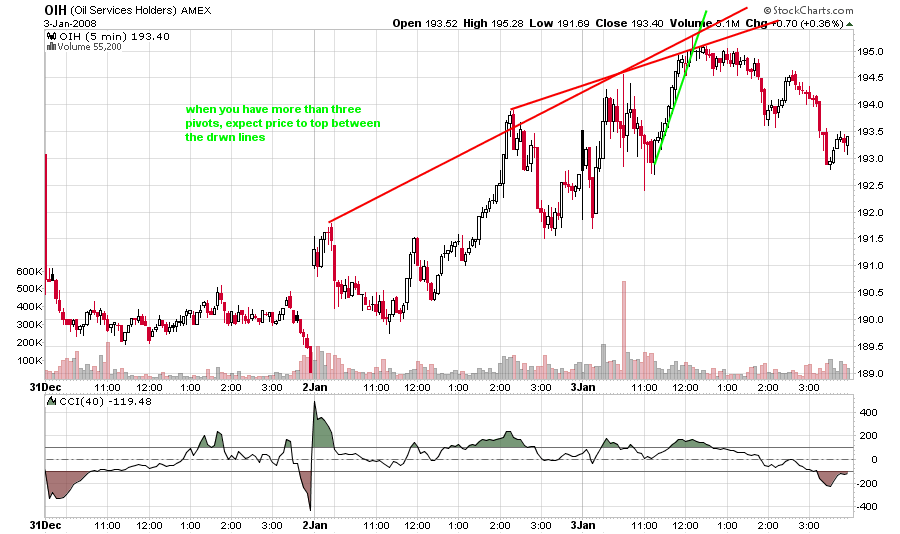
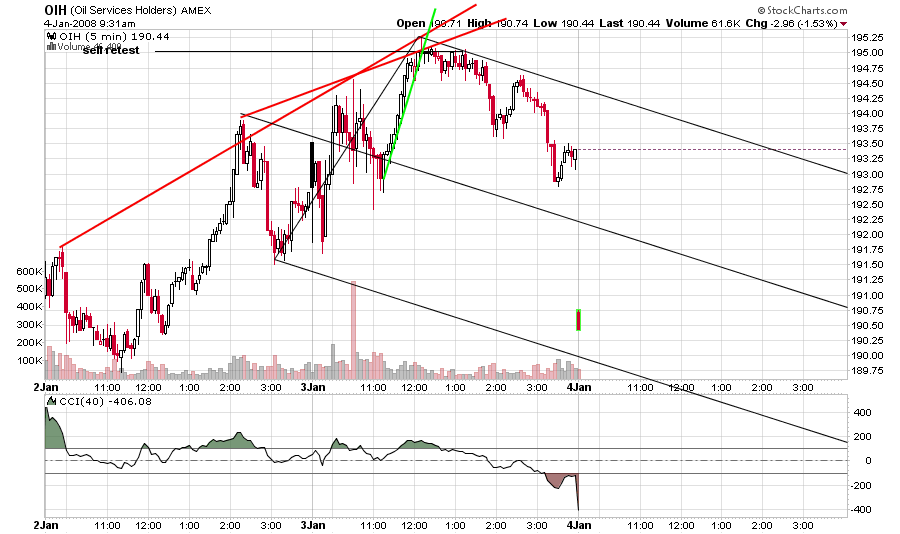
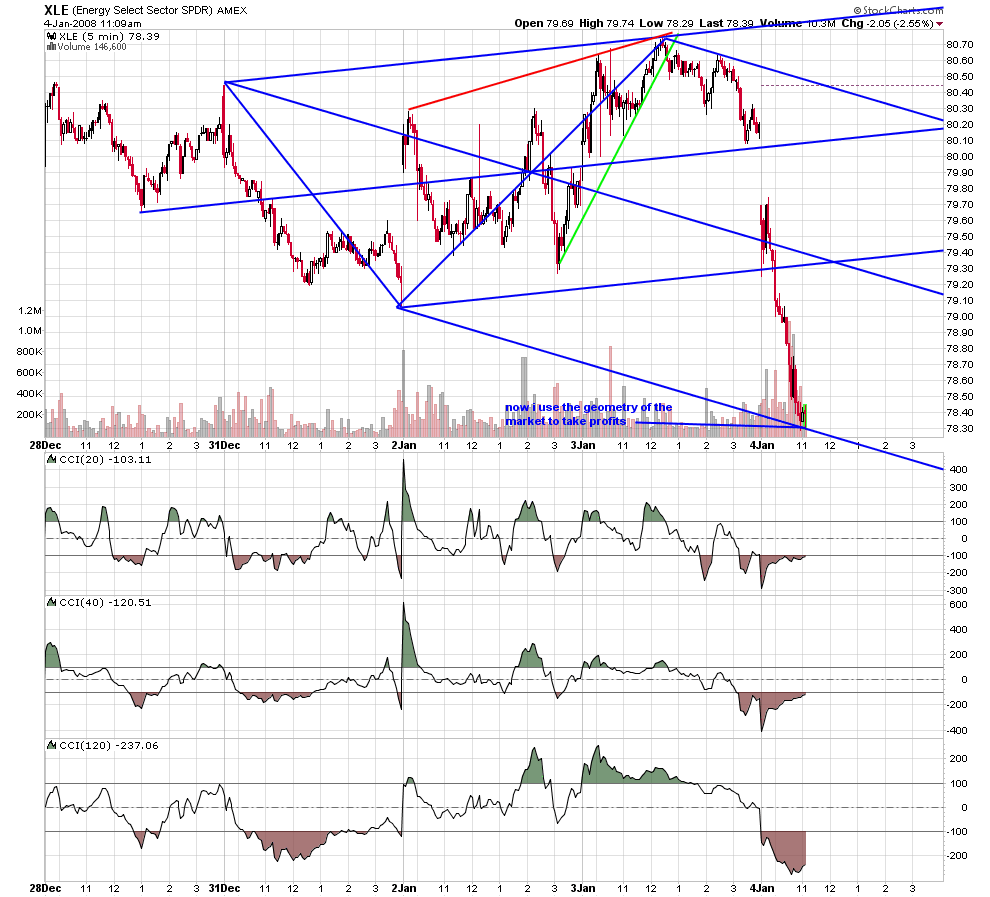
no forcasts just what is. i never know what is going to happen next. but here are two example from yesterdays trading that result from mapping the market in a different way. price at a line from medianline set is important... confluent with red spike line... we go to work... break of green trend line.. trade is on.from the kane traders.
Click image for original size
Click image for original size
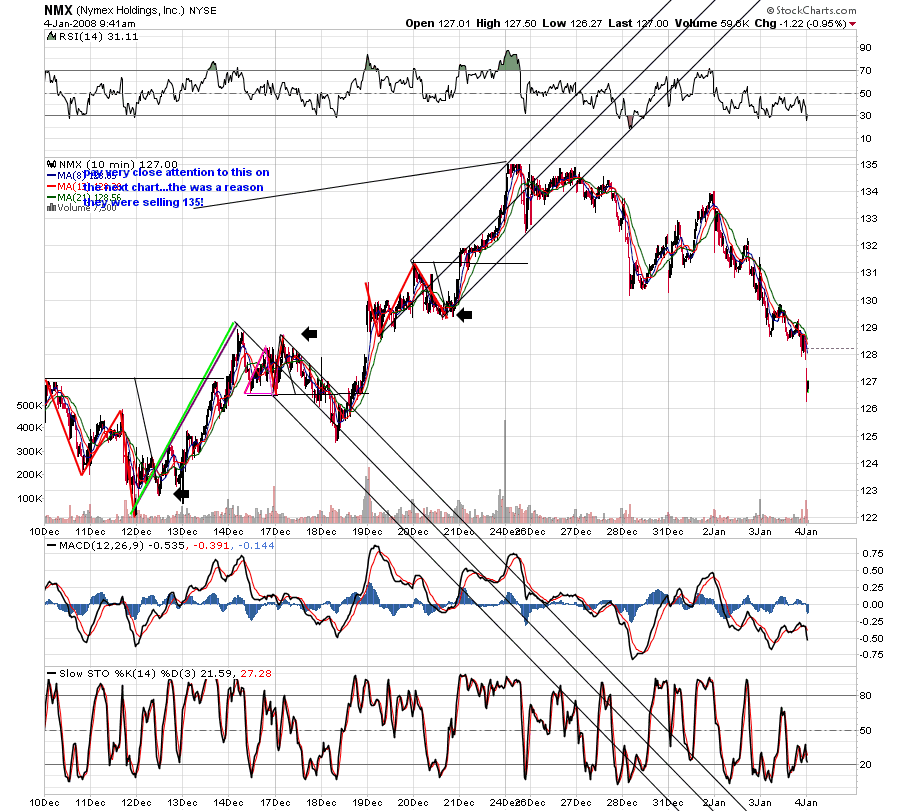
here is how kane traders have been trading AAPL the past few days using the same setup... price at line... spike line.. trendline break...
Click image for original size
chart
Click image for original size
Emini Day Trading /
Daily Notes /
Forecast /
Economic Events /
Search /
Terms and Conditions /
Disclaimer /
Books /
Online Books /
Site Map /
Contact /
Privacy Policy /
Links /
About /
Day Trading Forum /
Investment Calculators /
Pivot Point Calculator /
Market Profile Generator /
Fibonacci Calculator /
Mailing List /
Advertise Here /
Articles /
Financial Terms /
Brokers /
Software /
Holidays /
Stock Split Calendar /
Mortgage Calculator /
Donate
Copyright © 2004-2023, MyPivots. All rights reserved.
Copyright © 2004-2023, MyPivots. All rights reserved.