The pitbull alert zones....
EDIT****** I began updating this thread on page 5 ******
I originally had this posted before the market opened in the Traders Lounge but I think it would be better off here......zones are created off one minute high volume bars in this volatility from the previous days session and the overnight....
"Where I'll be looking for entries.....I was biased to the upside when I saw the lower prices in the overnight but I missed all entries....( market just backed away from the 32 area, down at 27 as I type so this area is critical).anyway here is what I see in the ES. The weekly pivot sits down in the 1320 area.....The range of the prior week is tested in the real time session a very high percentage of the time. The other thing I am aware of is that the fed meeting is coming and some may front run that to get long....so my preference is to buy at lower prices today....Your results may vary!!!!
1352 - 1355
1342 - 1345
1330 - 32.50
Since all these numbers are based off of volume I believe that they will act as magnets...and the standard support/ resistance rules apply...
1320 - 1324
1314 - 14.50
Some come close to the Value areas as posted on this site...good trading
Bruce
"
I will post some chart examples and further ideas hen I have more time...
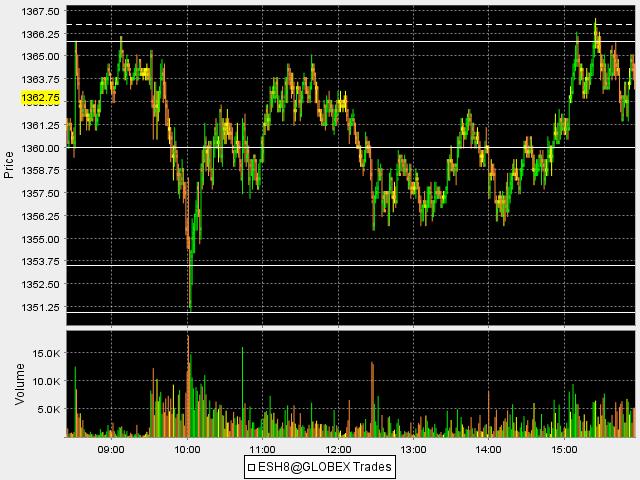
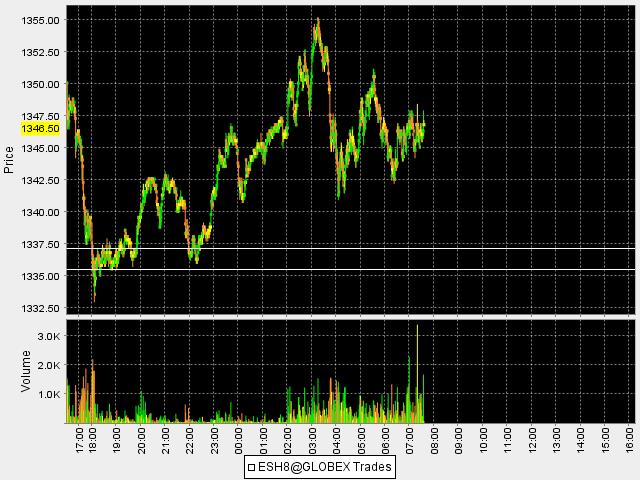
Here is a shot of today ( Tuesday)..note how the volume picks up BEFORE we get into that key zone at the 51 - 53.50 level...this was your first clue that the smart money ( hopefully it was you too) where buying into that break in prices....
You can also see how that volume spike bars high at 1365.50 ( far left on chart ) capped all the buying power today in the day session......I'm not showing any bars completely above that high once the day session began.
The value area high coming into today was 1351.50 so that was a good number. We also had a selling tail from the 25th which began at 1365.25.
Look at the selling spike at about 12:30....we never traded under that area again for the day.....if true selling was coming in we would have had some complete bars under there....you'll see these types of things happen on a daily basis and these spikes in volume will very often coincide with a high or low on the day.....that makes sense since the volume is really drawing price in the opposite direction...
Click image for original size
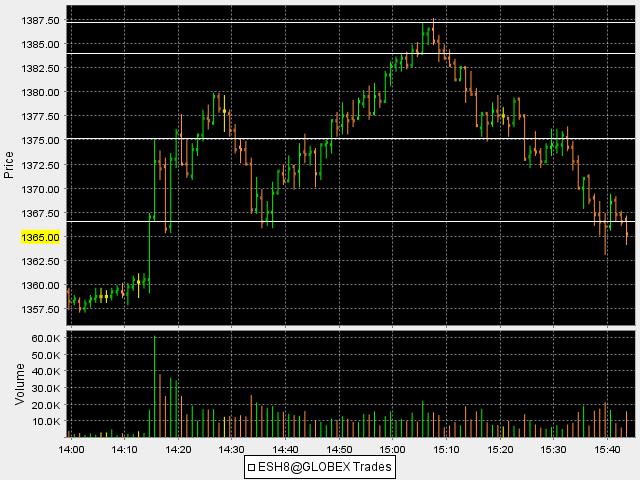
here is what recently happened on Fed day ( today)...I bracketed the highest volume one minute bar ...far left of the chart.....notice how the market could not get full minute bars below the bracket low.....then we started getting full minute bars above the high of that bracket....
notice at the current high of the day there is ( it looks small in comparison to the fed volume) a volume spike..at about 15:06...price up at 1387...then the market trades under the low of the high volume spike bar with full bars right away.......
Then look what area becomes temporary support at about 15:18..at the 1375 price....the same high that was bracketed after the announcement that created that volume surge...then it becomes resistence...
Market is down at 1359.75 as I type.....
Click image for original size
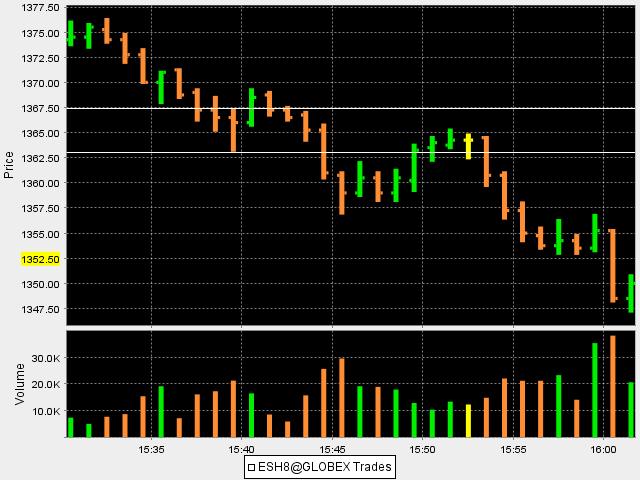
This is a good example of what happens when we trend and I will admit it can become tricky....
You will notice that I have bracketed the volume spike that happened at 15:39......we then had another one that happened on greater volume at 15:46.( not bracketed for clarity)..note that the previous spike at 15:39 becomes resistance..( the bars have traded back into that bracket)...we then sell off again and when we retrace again we test the 15:46 volume spike low....only to make lower lows at the 4 pm close of the cash market...
here is a chart...I hope some of this makes sense.....
Click image for original size
here is one that seems to be shaping up in the overnight as I type....I simply snapped a line at the one minute bar that created the highest volume spike on the downside....so far we have only spent 2 complete minute bars below that zone...it will be interesting to "see" what happens
Click image for original size
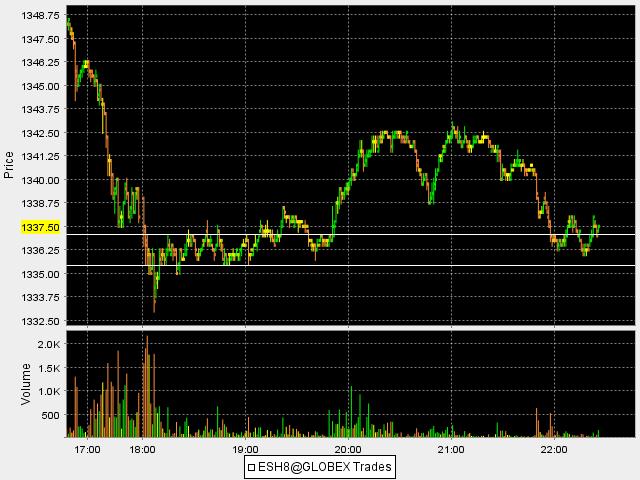
just woke up to see the result...."words fail me"......
WOW..powerful!!! Sure would like to claim bragging rights for the long trade but can't....
WOW..powerful!!! Sure would like to claim bragging rights for the long trade but can't....
Click image for original size
great call Bruce !
Thanks PT....this is cool stuff....I'm watching the following for today.
1355 - 1360 big zone
1345 - 48
1335 - 1337
1330
1321 -1323.50
I prefer long side and will be watching if we can build up above the 1337 to get to 45 area first. Otherwise my paln is to look for longs below the overnight low near the 30's..if not there then down in the 23 area///
1355 - 1360 big zone
1345 - 48
1335 - 1337
1330
1321 -1323.50
I prefer long side and will be watching if we can build up above the 1337 to get to 45 area first. Otherwise my paln is to look for longs below the overnight low near the 30's..if not there then down in the 23 area///
Very nice Bruce!
got two longs off your ES support level for nice profits, along with another couple of very nice mid trend longs in the ER2...
trading 101...big gap down into support... pick a direction...... the rest is just position management
trading 101...big gap down into support... pick a direction...... the rest is just position management
thanks for the feedback....breaking below 59.75 could put in the high for the day...huge volume push from that level on upside
OK, I wanted to get back to this thread once I purchased a microphone that worked....I made a video for the day trading threads last week which can be found here in case you haven't seen it
http://www.mypivots.com/board/topic/6588/1/es-trading-4-6-11
But if you've already seen it then skip down to this new video I just made...It's basically demonstrating the same things but it involves somewhat of a trend day..not a classic trend day as we had that consolidation period in the middle......and don't forget to do a search on user "BeyondMP" he made some posts with additional ideas you may consider if you like volume.
Emini Day Trading /
Daily Notes /
Forecast /
Economic Events /
Search /
Terms and Conditions /
Disclaimer /
Books /
Online Books /
Site Map /
Contact /
Privacy Policy /
Links /
About /
Day Trading Forum /
Investment Calculators /
Pivot Point Calculator /
Market Profile Generator /
Fibonacci Calculator /
Mailing List /
Advertise Here /
Articles /
Financial Terms /
Brokers /
Software /
Holidays /
Stock Split Calendar /
Mortgage Calculator /
Donate
Copyright © 2004-2023, MyPivots. All rights reserved.
Copyright © 2004-2023, MyPivots. All rights reserved.