kane awareness
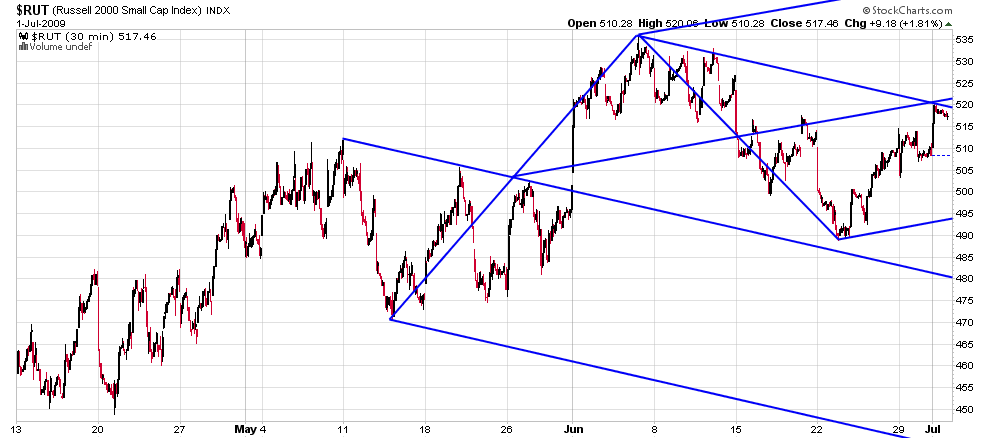
yesterday was a NR7 DAY....in medianline work, price at a line is important... the horizontal colored lines represent a cluster of 8 fib numbers that price has refused to cross multiple times... price has run out of room ... price is prepared for large move....
Click image for original size
ok roofer but are you looking for longs or shorts....? And then what is the entry signal and the stop if you take the trade......These alert zones are great...this seems like you are leaning short...please clarify...thanks
Bruce
Let me edit this with the following:
If you are posting this just to give us a warning then there is no need to "clarify" anything.....
My comments above were meant so nobody comes on here and says "see I told you to get Long/short"
Your set up would have me personally looking short but I'd be concerned about that volume that came in at those lows....
not to state the obvious here but I think this range contraction and expected range expansion may be related to the FOMC meetings yesterday and today...announcement on rates expected at 2:15pm this afternoon...
Look at the median line upper parallel that converges with the Fib grouping, Bruce, it's a short. My mini Russell chart hit just about dead on and rolled, as did the S&P. My methodology (which is not the same as roofer's, he has taken some of my work and blended it with his own work) looks to play convergences off the lines.
Thanks Jim...I'd be curious to know how you actually enter and exit with a profit or loss in this particular case..it doesn't matter if you actually took the trade. Do you like to dial down to a shorter time period and structure risk on the smaller time frame in order to get to a longer term time objective....? Perhaps you could walk us through this if you have the time and/ or motivation...
quote:
Originally posted by jimkane
Look at the median line upper parallel that converges with the Fib grouping, Bruce, it's a short. My mini Russell chart hit just about dead on and rolled, as did the S&P. My methodology (which is not the same as roofer's, he has taken some of my work and blended it with his own work) looks to play convergences off the lines.
Boy, it would be a really oversimplified explanation, and still long at that. I drop down, depending on the entry technique, a factor of 3-5, which I call the 'once lower timeframe', or by another 3-5 for techniques specific to 'twice lower'. But the 'traded timeframe' also has a way I standardize that, based on the pattern, lest the dropping down is random based on whatever timeframe you happen to start with.
I prefer the techniques I developed for the 'twice lower' timeframe. So, for a 60-minute traded timeframe once lower may be 13-min, and twice lower 3-minute (the 'traded timeframe' on this example would be two bars per day, so 13-min would be the twice lower timeframe, but since the monster Fed reaction runup drove it to the area, this required a much lower timeframe and some specialized variations to get the entry trigger, as the 13-min was way too course given the action).
The risk will depend on where it triggers via whatever technique or technique variation I use (in my books I show many variations of various techniques and encourage readers to see if they like any of them, and to then experiment with them until they find something that works for them). I know, visually, how far beyond the reversal point I want my stop, and I can also use the various 'sug-groupings' that my methodology shows me for stop placement.
I have several (actually four that I use) ways I can then compare the initial risk to the pattern itself to see if my stop size fits what I would expect, and it usually does. If it doesn't, I'd see it by eye anyway, but I like to have ways to check this. Now, using some other concepts I have a 'statistically average' (not from a hard scientific study, but just from having looked at thousands of charts and drawn my own conclusions) move that I expect if it 'plays out', and I use that to do a quick reward/risk calculation, and I'm looking for 3 to 1 to 5 to 1, since my methodology is 'trend trading', even if it is intraday trend trading in some cases.
I pretty much never use 'profit targets', and likely never will. There is a lot that I do as far as management (I go into great detail on this in my trade management book) before the expected area is reached, but once it gets close, if it is trending somewhat smoothly I tighten up various trailing stops and ride with it, even if it hits a strong resistance area, because until it reacts, to me it is just 'potential resistance'. I then see what happens, and stay with it until it tells me it is over.
This is all a very oversimplified explanation. I've worked it out so I know the steps and can do it all very quickly and quite easily, as far as calculations, what to do where, and how it should all fit together. It may seem complex, but once I 'figured it all out', as far as what I want to do and why, it is quite simple. Find the area of interest, watch the price action as it hits the area, determine the intial 'theoretical' risk (which is then used to decide on the position size), wait for an entry trigger showing the area is 'seen', and then manage according to the management plan.
The thing I like about my methodology is that it seems to apply equally well to stocks, commodities, FOREX, and on any liquid timeframe (I've used it from 13-tick charts to monthly charts). There are no indicators, only price action, and nothing specific to a given market (like TICK, TRIN, TIKI, PREM, or whatever).
I hope this helps.
Thanks for the response Jim, I used to prefer a 3 minute chart and a 15 minute time frame...it worked well as I was able to structure the risk off the 3 minute for the 15 minute trend (higher highs and higher lows for longs).
Your words below sum it up nicely
". Find the area of interest, watch the price action as it hits the area, determine the intial 'theoretical' risk (which is then used to decide on the position size), wait for an entry trigger showing the area is 'seen', and then manage according to the management plan."
Bruce
Emini Day Trading /
Daily Notes /
Forecast /
Economic Events /
Search /
Terms and Conditions /
Disclaimer /
Books /
Online Books /
Site Map /
Contact /
Privacy Policy /
Links /
About /
Day Trading Forum /
Investment Calculators /
Pivot Point Calculator /
Market Profile Generator /
Fibonacci Calculator /
Mailing List /
Advertise Here /
Articles /
Financial Terms /
Brokers /
Software /
Holidays /
Stock Split Calendar /
Mortgage Calculator /
Donate
Copyright © 2004-2023, MyPivots. All rights reserved.
Copyright © 2004-2023, MyPivots. All rights reserved.