Speed of Market and Stops
It may be that my brain's asleep and that is why I can't answer this question but does anybody know of an indicator that measures "speed of market?" A sort of MPH measure for the market or a variometer (rate of change of elevation) style indicator. Something that gives you the points range in the last X minutes.
I'm thinking along the lines of back testing some theories with respect to stops. My theory is:
If you have a fading entry strategy (i.e. you're trying to pick the top/bottom of a move for entry) then using that strategy will be less profitable in high speed markets than in low speed markets because the stops will be hit more often if you use the same sized stop.
So the speed-of-market indicator could be used to filter such a strategy for improved results.
Interesting idea. I mostly rely on Tape and the time it takes to print a candle. If I see the prices jumping insanely fast I'll use a wider stop strategy to plan my entries around it. I'll admit, it'd be nice to have an indicator to gauge these readings in a more relative manner with backtested results. I bet it's not even that hard for a programmer to do this. I'm not very good at programming though. =/.
I'm fairly certain that you're right and that it's not difficult to program. The idea is amazingly simple though so I'm wondering why I haven't heard of it before or nobody else has already tested it. You could also add another dimension to it and have both the range and volume over a given time period(s) and use that as an indicator.
I'm still mulling over this idea so please bear with me while I type aloud...
I just received an email while typing this which said:
So here is a 1 minute chart of the ES from today with the Directional Movement indicator and the ADX with 14 period smoothing in pink.
I'm still mulling over this idea so please bear with me while I type aloud...
I just received an email while typing this which said:
quote:
The adx has a directional movement component. Theres a plus line, a negative line and a line that shows the strength of the move, no matter what direction. Would that help?
So here is a 1 minute chart of the ES from today with the Directional Movement indicator and the ADX with 14 period smoothing in pink.
Click image for original size
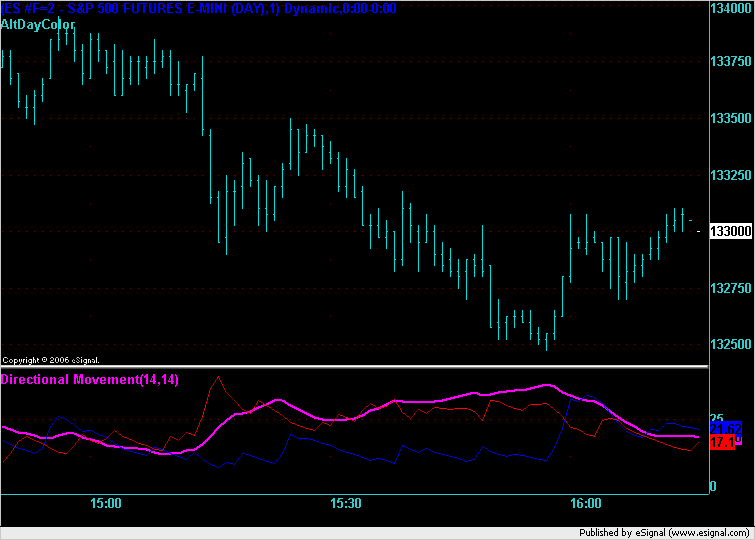
I'm not sure if the Directional Movement would work. Look at those 3 down bars at around 15:13 on the chart. Say you had a buy signal at the close of the second bar and you always use a 2 point stop. This is an example where you'd get stopped out on the third bar. Now if you had taken a measure of the range of the first 2 large down bars and it was say 3 times bigger than the range of the previous 3, 6, or 9 bars (or whatever you're measuring) then you filter out the trade because the sudden increase in range makes the stop-hit more likely and the trade success less likely.
So I guess what I'm talking about is a spike in volatility. Perhaps the answer is to measure volatility now (say last 5 bars) against volatility over double the time period (say last 15 bars) and if that ratio is greater than (say) 2 then filter out signals until the short/long volatility ratio is back in a controlled range.
So I guess what I'm talking about is a spike in volatility. Perhaps the answer is to measure volatility now (say last 5 bars) against volatility over double the time period (say last 15 bars) and if that ratio is greater than (say) 2 then filter out signals until the short/long volatility ratio is back in a controlled range.
Emini Day Trading /
Daily Notes /
Forecast /
Economic Events /
Search /
Terms and Conditions /
Disclaimer /
Books /
Online Books /
Site Map /
Contact /
Privacy Policy /
Links /
About /
Day Trading Forum /
Investment Calculators /
Pivot Point Calculator /
Market Profile Generator /
Fibonacci Calculator /
Mailing List /
Advertise Here /
Articles /
Financial Terms /
Brokers /
Software /
Holidays /
Stock Split Calendar /
Mortgage Calculator /
Donate
Copyright © 2004-2023, MyPivots. All rights reserved.
Copyright © 2004-2023, MyPivots. All rights reserved.