SPY could be leading the markets...
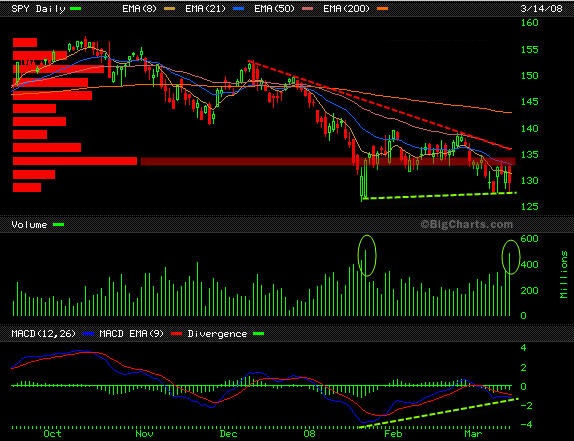
ALL the index ETF's are showing similar traits with divergence and volume based support. One set stands out from the others to me though and thats the SPY/ S&P. I think this guy has a chance at leading the way for what's to come in the broad markets.
Here is my view. I remain bullish mid term and think we could get a large rally before the herd expects it.
Shorts will probably SCREAM and cover from this next wave also.
Macd divergence is fairly large and macd histogram divergence is backing us up as well.
Volume, volume, volume. Folks volume like this down low is bullish, that's not retail, that's big bucks moving around and in this case buying in at the lows. Why do I think it's buying...look at the support level and how it's been fought with big $. Go to the intraday charts and look where the volume is focused at...down low. Pros don't buy high and sell low folks.
Yes we have a descending triangle, yes we have both volume by price and the top trendline as resistance. BUT the top trendline is pinching off and building pressure like a spring. This spring is getting tight and that's why I feel whichever direction it breaks will have some great momentum behind it. Based on the above backing reasons I have to carry a bullish bias and fade the herd here mentally.
All that being said, a wise trader may have a bias but rarely trades on it. You should be ready for momentum to either side for the best odds of a winner. If your aggressive you could buy at support down low. The more conservative approach will be to have a buy stop AND sell stop in place just outside the triangle so whichever way it breaks you would capture some of the momentum early and then just trail the stops and manage the trade.
Good trading :)
MC
Click image for original size
Here is my view. I remain bullish mid term and think we could get a large rally before the herd expects it.
Shorts will probably SCREAM and cover from this next wave also.
Macd divergence is fairly large and macd histogram divergence is backing us up as well.
Volume, volume, volume. Folks volume like this down low is bullish, that's not retail, that's big bucks moving around and in this case buying in at the lows. Why do I think it's buying...look at the support level and how it's been fought with big $. Go to the intraday charts and look where the volume is focused at...down low. Pros don't buy high and sell low folks.
Yes we have a descending triangle, yes we have both volume by price and the top trendline as resistance. BUT the top trendline is pinching off and building pressure like a spring. This spring is getting tight and that's why I feel whichever direction it breaks will have some great momentum behind it. Based on the above backing reasons I have to carry a bullish bias and fade the herd here mentally.
All that being said, a wise trader may have a bias but rarely trades on it. You should be ready for momentum to either side for the best odds of a winner. If your aggressive you could buy at support down low. The more conservative approach will be to have a buy stop AND sell stop in place just outside the triangle so whichever way it breaks you would capture some of the momentum early and then just trail the stops and manage the trade.
Good trading :)
MC
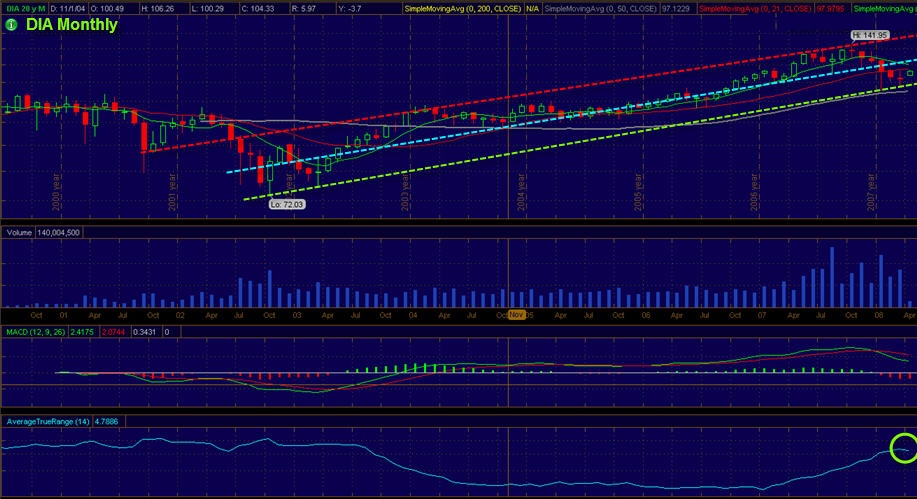
Long term investing right now could be an incredible place to be, I feel the market has a VERY good shot at breaking into bull trend mode again soon. In January I predicted the 14k dow level to be tested (if not smashed) this year, let's see how much doom n' gloom is left and if I'm really crazy. ;)
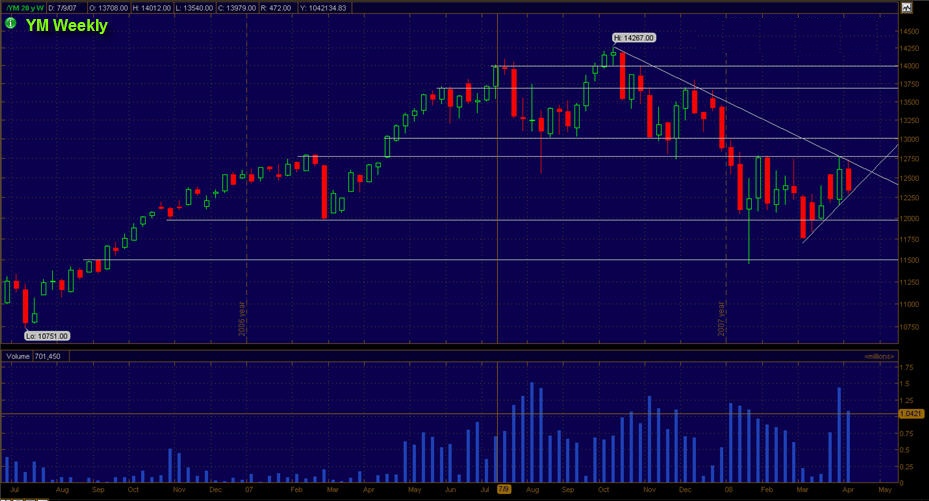
Here's the monthly where we have a nice channel we are in. Why would I call this a correction and not a bear market? Well for one the upwards channel has held up thus far and on top of that the 8ma hasn't crossed below the 21ma. We have been and are still in a "bear trend" but a bear market to me is not a accurate assessment yet. The 50ma and trend line are acting as confluent support. Note the ATR curling down which is often a sign of bullishness. ATR goes up when emotion is injected in the game by gloomy news to shake people out of shares.
Note the triangle we are in, descending. SO the path of least resistance technically is down. That being said the range is getting tight and much of my other evidence points up. The macd is near crossing for the bulls. Watch for the downtrend line and 21ma along with structure resistance to break. The worst should be over if we can break all those down. The next hurdle will be the 50ma.
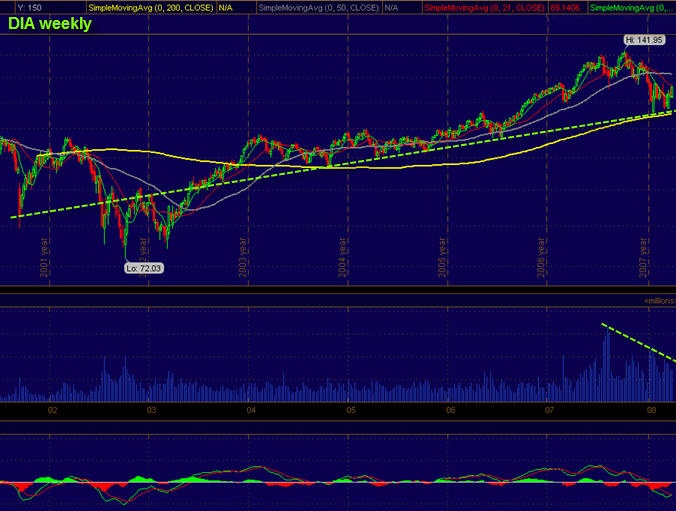
The uptrend that's held so far actually stems back to late 2001. Yes the y2k bear broke the line down but TA is an art. Don't think that a trendline can't be broken yet remain valid. Look at how many times we have successfully tested this trendline, that cannot be ignored. Support wise we are backed by the confluent 200ma and trendline. Volume is concentrated at the bottoms which is accumulation, also the volume has decreased as the price has taken out new lows which shows selling could be drying up. On the mini runs the volume is pretty light so it appears they are not flipping and that confirms accumulation IMO. I do my analysis from the top down, starting with monthly and then getting more granular. Why is simple, because look at a daily chart and you will get whipsawed to hell. You need to go out further to reduce the noise on the charts.
Good trading,
MC
Here's the monthly where we have a nice channel we are in. Why would I call this a correction and not a bear market? Well for one the upwards channel has held up thus far and on top of that the 8ma hasn't crossed below the 21ma. We have been and are still in a "bear trend" but a bear market to me is not a accurate assessment yet. The 50ma and trend line are acting as confluent support. Note the ATR curling down which is often a sign of bullishness. ATR goes up when emotion is injected in the game by gloomy news to shake people out of shares.
Click image for original size
Note the triangle we are in, descending. SO the path of least resistance technically is down. That being said the range is getting tight and much of my other evidence points up. The macd is near crossing for the bulls. Watch for the downtrend line and 21ma along with structure resistance to break. The worst should be over if we can break all those down. The next hurdle will be the 50ma.
Click image for original size
The uptrend that's held so far actually stems back to late 2001. Yes the y2k bear broke the line down but TA is an art. Don't think that a trendline can't be broken yet remain valid. Look at how many times we have successfully tested this trendline, that cannot be ignored. Support wise we are backed by the confluent 200ma and trendline. Volume is concentrated at the bottoms which is accumulation, also the volume has decreased as the price has taken out new lows which shows selling could be drying up. On the mini runs the volume is pretty light so it appears they are not flipping and that confirms accumulation IMO. I do my analysis from the top down, starting with monthly and then getting more granular. Why is simple, because look at a daily chart and you will get whipsawed to hell. You need to go out further to reduce the noise on the charts.
Click image for original size
Good trading,
MC
Click image for original size
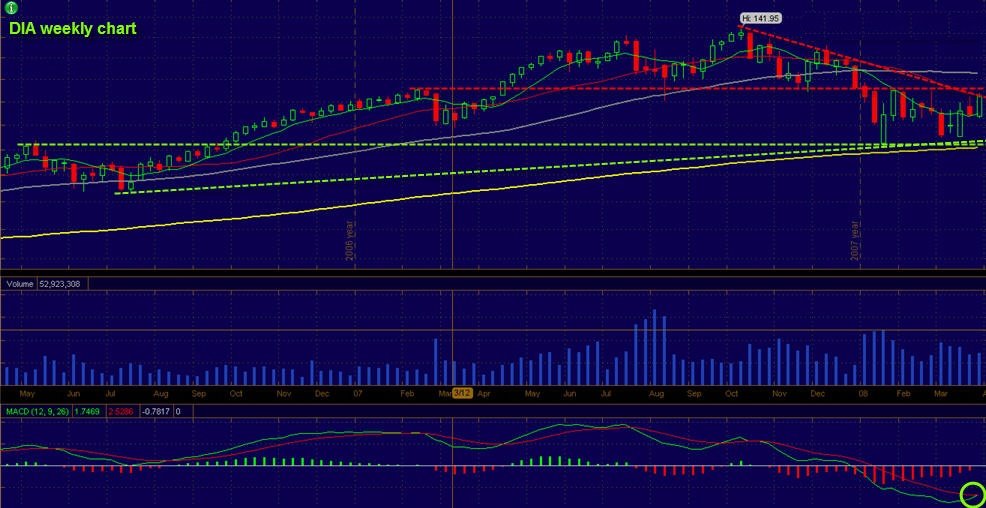
Hrmmm...thoughts? I don't like that volume at resistance at all.
I'd much rather have seen low volume on a failure to breakout, seems like possible distribution to me.
I might say that was decent volume, so all effort with no result.
$TRIN closed well above the 2.0 level.
Based on that alone...IF we don't have an up day Monday the mid term could be nasty n' bloody.
Click image for original size
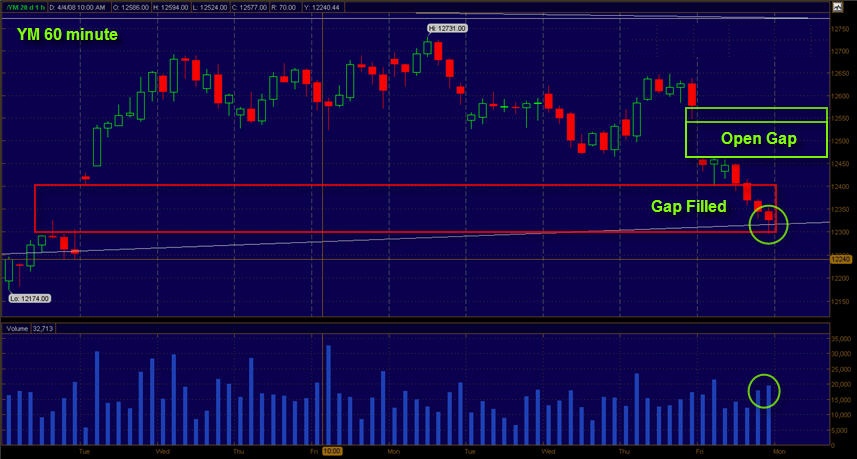
This chart shows some volume stepping in at a trendline based on the weekly as well as a complete gap fill from back on 3/31. We now have the open gap above formed from todays opening gap down.
Monday should be interesting, then again what day in the market isn't interesting? ;)
Emini Day Trading /
Daily Notes /
Forecast /
Economic Events /
Search /
Terms and Conditions /
Disclaimer /
Books /
Online Books /
Site Map /
Contact /
Privacy Policy /
Links /
About /
Day Trading Forum /
Investment Calculators /
Pivot Point Calculator /
Market Profile Generator /
Fibonacci Calculator /
Mailing List /
Advertise Here /
Articles /
Financial Terms /
Brokers /
Software /
Holidays /
Stock Split Calendar /
Mortgage Calculator /
Donate
Copyright © 2004-2023, MyPivots. All rights reserved.
Copyright © 2004-2023, MyPivots. All rights reserved.