Trend or Contra-trend? That is the question.
Reminds me of "To be or not to be?"
For the most part, I am a contra-trend trader, but I would like to become more balanced if it can make me more successful. I'm interested in hearing what successful trend traders use, indicators or otherwise, for their entries and exits for ES.
My simple observation is the ES doesn't trend a great deal of the time, but maybe I just don't have the confidence to make the trend my friend.
I agree with BruceM - regular session data. The reason is because the Market Profile chart is constructed against time (as apposed to volume) and the relevant activity (relevant volume) is during the regular session. The developing value area becomes more important as the day progresses.
quote:
Originally posted by topgun
Thanks. Is there a way to convert or read this information on customary bars or is the exclusive to MP. I use a 3 and 15 minute bar.
You can plot the value area on your chart each morning using two horizontal lines. DT has a thread where he posts the value area each evening after the close of the trading session. For anyone using eSignal, DT has this built into his toolbox.
A value area is nothing more than an area of price congestion, a trading range between intra-day support and resistance.
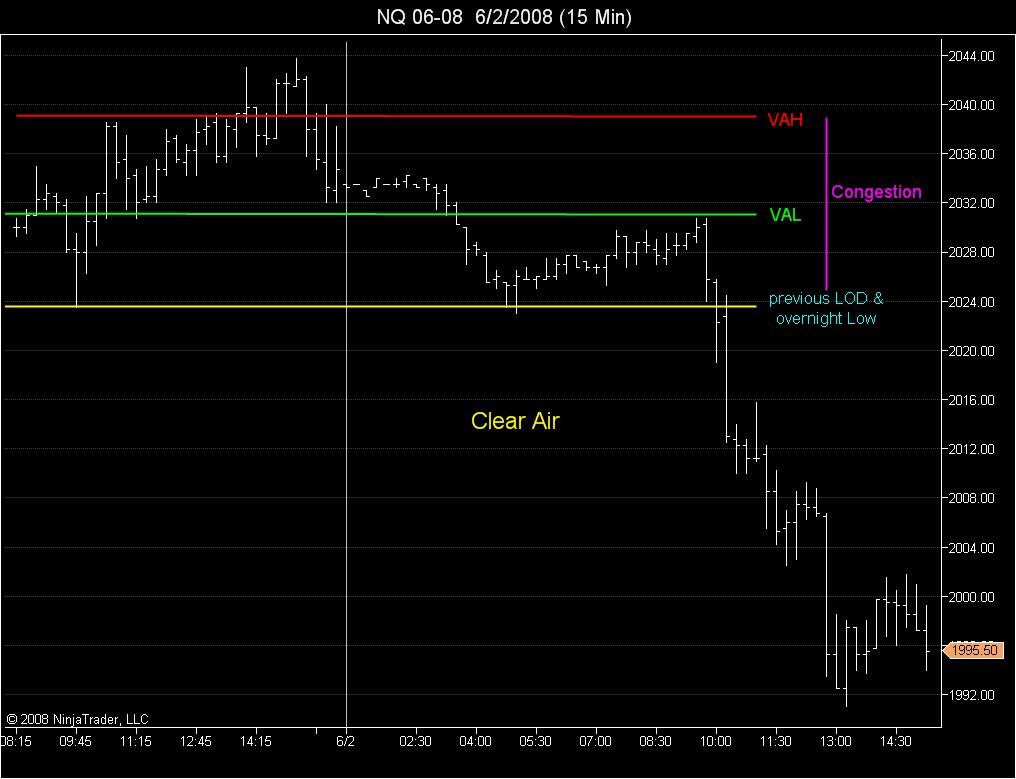
When studying a traditional price chart, keep in mind my phrase "clear air". I like to visualize price congestion as the area of turbulence an airplane flys through... where is the maximum turbulence? It's in the clouds. When the aircraft is flying through the clouds visibility is poor and turbulence is high, once the aircraft breaks through the cloud deck it is in the clear air, above the turbulence where visibility is good. Likewise when price is inside value (congestion) trading tends to be choppy with poor volume and slow order flow. Once price breaks free of congestion, into the clear air, trading tends to become more directional with greatly improved order flow.
On your traditional bar or candlestick chart, look horizontally from current price on the right side of the chart to the left... in clear air, there will be no bars to the left of the current price, it will be a blank area on the chart.
Here is a nice example using the 15 minute bar chart of the NQ from this morning...
Click image for original size
Thanks for that chart. Are you saying that clear air is essentially a breakout trade from the congestion? Do you have any data on how often an ES breakout to clear air continues or "head fakes" and goes back into the range?
I recall a seasoned ES trader telling me that playing breakouts on ES is not a profitable strategy on balance. Any thoughts?
I recall a seasoned ES trader telling me that playing breakouts on ES is not a profitable strategy on balance. Any thoughts?
The back and fill process that goes on in the S&P makes it a perfect instrument for fading. Like any thing else, you will find those that can make it work when it trends also. Of course all this depends on your time frame and risk tolerance. For some a breakout or break down off a one minute congestion period becomes a fade in a longer term direction so I guess you would need to qualify your question a bit more.
I can only say that for me my results improved dramatically when I started buying into breaks and selling rallies along with having additional contracts to hold for longer gains.
An example of what I am rambling about happened today. The S&P was consolidating as it was trying to break out of its 60 minute high. So you could see consolidation on lower time frames. When it finally did break out of the high the Nq's and YM where no where near there highs.....( here we have one market, the ES trying to lead two markets higher and was hitting up against it's weekly pivot at the 92 area) so the best entry was to fade that breakout but if you missed that you could have sold a lower time frame congestion zone ( you become a lower time frame breakdown player) hoping that you would be catching the bigger ride down....hope some of that makes sense..
Bruce
quote:
Originally posted by topgun
I recall a seasoned ES trader telling me that playing breakouts on ES is not a profitable strategy on balance. Any thoughts?
Originally posted by topgun
Are you saying that clear air is essentially a breakout trade from the congestion?
What I am saying is when price breaks free from a well established value area, fading the ensuing high momentum price move away from value is generally not profitable. In this case you are fighting the single prints, what Dalton calls the other time frame traders, and in general you don't want to do that. It's a hard way to make a living.
Do you have any data on how often an ES breakout to clear air continues or "head fakes" and goes back into the range?
The answer to that question is situation dependent, therefore very complicated. There are a great many special cases (exceptions) that must be accounted for in order to answer the question accurately.
I recall a seasoned ES trader telling me that playing breakouts on ES is not a profitable strategy on balance. Any thoughts?
I think the same can be said for pretty much any method or strategy. Given enough time most methods tend to revert to the mean. In reality, most traders tend to gravitate towards a method that fit's their personality, thus the method used has more to do with how the trader feels using the method than objective statistics. The trader you mentioned probably feels more comfortable fading momentum and thus believes trading in the direction of a trend is not profitable.
pt, in the chart you posted, when the mkt broke the prior LOD/overnight low, was that a sell for you?
quote:
Originally posted by topgun
pt, in the chart you posted, when the mkt broke the prior LOD/overnight low, was that a sell for you?
To really understand that specific trade, you must look at the daily bar chart. Call up a 1 month daily bar chart and draw an uptrend line connecting the daily lows of the prior week's bars. Notice how taking out Friday's VAL violated that 4 day uptrend line. In my work, the break of a steep 4 day trendline is a powerful signal. The break of Friday's low and the overnight (globex) low was additional confirmation of the new price direction (down), and as we now see added signficant jet fuel to the fire. In this actual trade, I was holding contracts short (over the weekend) established above the 1240 level on Friday. Also, Monday morning I added more size to the open short position within the first two retracements after the break below that last support level (Friday's low). In my view anyone fading that breakout and prematurely trying to pick a bottom would quickly get burned, which they did obviously.
Emini Day Trading /
Daily Notes /
Forecast /
Economic Events /
Search /
Terms and Conditions /
Disclaimer /
Books /
Online Books /
Site Map /
Contact /
Privacy Policy /
Links /
About /
Day Trading Forum /
Investment Calculators /
Pivot Point Calculator /
Market Profile Generator /
Fibonacci Calculator /
Mailing List /
Advertise Here /
Articles /
Financial Terms /
Brokers /
Software /
Holidays /
Stock Split Calendar /
Mortgage Calculator /
Donate
Copyright © 2004-2023, MyPivots. All rights reserved.
Copyright © 2004-2023, MyPivots. All rights reserved.