Crash looming?
Looks like you're right.
So the Royal Bank of Scotland's analyst prediction was RIGHT O/N back in late June.
I bet he never envisaged his bank would face its own meltdown..
Excellent long term SPX chart was posted upstream in this topic,
Also CNBC's Jim Cramer (normally cant listen to him) but he showed charts
last night that showed NO-ONE shud get into this market for a very
long time.
I bet he never envisaged his bank would face its own meltdown..
Excellent long term SPX chart was posted upstream in this topic,
Also CNBC's Jim Cramer (normally cant listen to him) but he showed charts
last night that showed NO-ONE shud get into this market for a very
long time.
Click image for original size
Click image for original size

Click image for original size
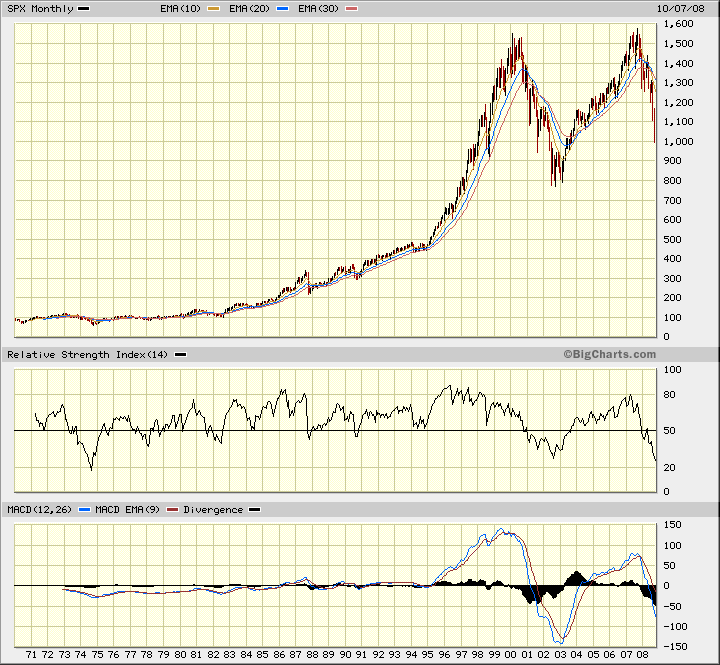
Here's the updated version of that SPX monthly charts.
The C leg of the A-B-C correction is now clearly evident.
It looks like the C leg is a 5 wave decline and wave 3 is currently forming. If it is, its highly probable it will test 800 level and breach it. It already breached the 1050 level forecasted last June.
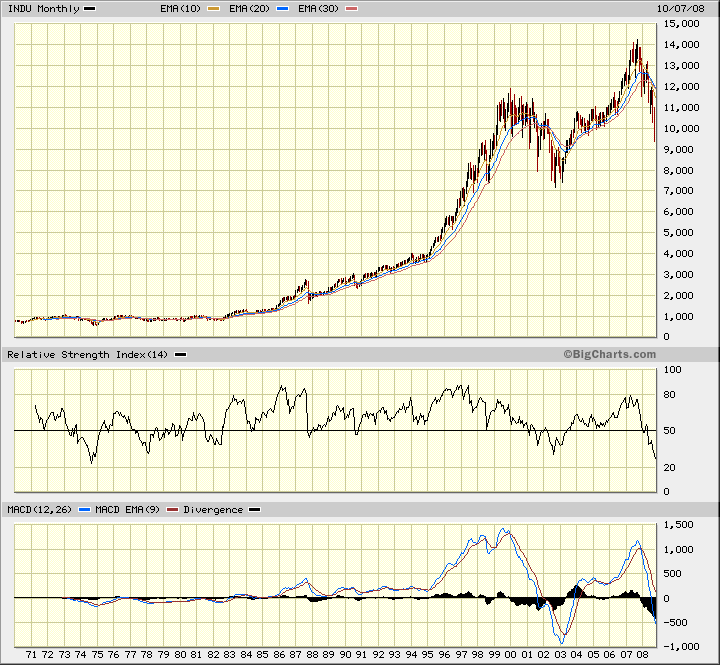
As a comparison, I also attached the DOW chart. Notice how strong is the MACD divergence signal. We could all be millionaires by now if we followed our charts and not our guts. We'll, we're all humans after all.
Click image for original size
Resending SPX monthly 30 year
This fall has been much steeper than the last going by those charts. I would at least be betting on a retest of those '02 lows considering how weak the markets have been. But the last drive down in '01 may have had something to do with the terrorist attacks. I cannot remember much in '02 but I don't remember it being this bad....
According to one Elliottician the swing high from early 2003 to Nov 2007 was actually the 5th wave of the 5-wave bull market that started in the early 80s. The 1987 crash was actually the 2nd wave correction. The decline from Nov 2007 to present is the A leg of the A-B-C correction unfolding. The forecast is the C leg will terminate at around 500 level - that is where the SPX in 1996.
The $60 Trillion derivative problem will help push back the market to that level. Let see.
The $60 Trillion derivative problem will help push back the market to that level. Let see.
I tend to agree, just by looking at the longer term chart this things got some massive steam behind it. It took about 18months last time to go from highs to sub-1000 we reached it 6MONTHS FASTER this time!!
quote:
Originally posted by CharterJoe
But the last drive down in '01 may have had something to do with the terrorist attacks. I cannot remember much in '02 but I don't remember it being this bad....
In 2001, the Greenspan Fed raised interest rates into an already weak market environment triggering a break of price support levels and continuation down leg in the developing bear market (tech / Nasdaq crash). Greenspan wanted to remove the "irrational exuberance" from the stock market by deflating the tech stock bubble.
The 9/11/01 terrorist attack occurred very late in the bear market cycle and precipitated a panic low in the stock market.
The psychology was much worse in the 2001 panic, because the markets were closed for a week after the terrorist attack. For example, the seat of the US govt. was evacuated out of Washington and being run from a secure underground bunker. Airline travel was suspended, stranding millions of travelers. The expectation was the initial attack was a precursor to a second major attack involving WMD. Thankfully, that was not the case.
When the markets were allowed to re-open the following week, the Dow collapsed in a straight line free fall, this final panic induced capitulation took 5 trading days to complete. From this panic low the market quickly recovered, with the help of aggressive rate cuts by the Fed.
The current bear market environment is a bit different, because it is spanning weeks instead of days, its a more grinding and wearing environment. Rather than the one single event, reaction and recovery we saw in 2001, today we have an environment of sustained high volatility. With each break of price support the Fed and Treasury come in with a new bailout or stimulus reaction, be it a direct injection of liquidity, rule changes, fed funds rate cut, or as we see at 7am this morning a coordinated rate cut. So far they have thrown everything at this market to stop the decline, but nothing has worked yet. This induces extreme volatility and steadily erodes confidence that a solution can be found.
Very well worded PT,
I wish I had keep a journal, thanks for the update. What were the fed fund rates in 02' at the lows? What worries me is there is only 1.5 points left thats not much of anything left to throw at this bear. Perhaps that was why it was a global effort this time...
I wish I had keep a journal, thanks for the update. What were the fed fund rates in 02' at the lows? What worries me is there is only 1.5 points left thats not much of anything left to throw at this bear. Perhaps that was why it was a global effort this time...
In response to the 9/11 attack, the Fed dropped the fed funds rate to 3%. The Fed continued cutting rates in 1/2 point steps all the way down to 1% in 2003.
With this morning's rate cut to 1.5%, we are just one rate cut from that 1% floor.
Your point is well taken, the Fed has much less wiggle room for subsequent rate cuts in the months ahead. I think the Fed would prefer the luxury of a 3% fed funds rate today, giving them the breathing room they might need if things fail to stabilize and instead continue on the present course.
Daytrading,
My dad has been in housing for 35 years so have my brother-in-laws and I am licensed contractor, I built 8 homes from the bottom in '02-'05 and I GUARANTEE I put more money on the line in housing then some daytraders I called the housing bottom in 02' while every one else in my town didn't dare build...You have to predict housing a lot different than the stock market if you wait for the bottom by the time your spec is done the market is flooded. Its just like trading, i.e. build/trade when all others are scared and sit on the sidelines when mom and pop are coming out of the woods...intrest rates are low, building material is cheap, gas is lower. The only thing missing is the banks willing to lend money and the FED is bent on changing that, so its a no duh thing to all of us contractors who pulled out at the highs to get ready for some spring building.
My dad has been in housing for 35 years so have my brother-in-laws and I am licensed contractor, I built 8 homes from the bottom in '02-'05 and I GUARANTEE I put more money on the line in housing then some daytraders I called the housing bottom in 02' while every one else in my town didn't dare build...You have to predict housing a lot different than the stock market if you wait for the bottom by the time your spec is done the market is flooded. Its just like trading, i.e. build/trade when all others are scared and sit on the sidelines when mom and pop are coming out of the woods...intrest rates are low, building material is cheap, gas is lower. The only thing missing is the banks willing to lend money and the FED is bent on changing that, so its a no duh thing to all of us contractors who pulled out at the highs to get ready for some spring building.
Emini Day Trading /
Daily Notes /
Forecast /
Economic Events /
Search /
Terms and Conditions /
Disclaimer /
Books /
Online Books /
Site Map /
Contact /
Privacy Policy /
Links /
About /
Day Trading Forum /
Investment Calculators /
Pivot Point Calculator /
Market Profile Generator /
Fibonacci Calculator /
Mailing List /
Advertise Here /
Articles /
Financial Terms /
Brokers /
Software /
Holidays /
Stock Split Calendar /
Mortgage Calculator /
Donate
Copyright © 2004-2023, MyPivots. All rights reserved.
Copyright © 2004-2023, MyPivots. All rights reserved.