Larry Williams darlings - help needed!!
I may have asked this before but I'm looking for an online stock screener ( preferably free) that can help me scan for LW's darlings.
We can debate the validity/credibility of Williams at another time but here is what they are:
The Darlings are the low priced DJIA stocks that have low price to sales and low FORWARD 12 month p/e ratios
Here is what I want to do:
I want to subtract the P/S and the price to cash flow ratio from the stocks dividend yield. The stocks with the highest figures are the ones to buy but as a final filter I want to take the top 5 - 7 stocks that have the LOWEST 12 month forward p/e ratios.
Whew !! You math guys are too much.
Any help would be appreciated..
Bruce
I bought spy's at 95.05 today....
I closed these out about 9 days ago......I consider this a failed experiment even though it was profitable.....was looking to get better at timing.
My new experiment is now short the SDS ( Ultra S&P short ) at a price of 27.30. I am looking to add to this trade if we trade higher after the fed announcement today. Hopefully as the emini S&P trades about the 1200 level...
Sentiment is very bullish right now, and the percentage of stocks above their averages is approaching 80% on some readings....lots of divergences in breadth up here also....
we'll see.....so far election results have not moved the market...lets see what the fed can do....it's possible we may have a "sell the news " situation on the longer term. Many of these concepts/ideas make good reading for a vendors book after the fact but putting the trades on as they happen can be very different!
May the force be with us all!!!!!!
The force is strong with this young Bruce...
LOL...LORN......interesting that advance/decline favored declines 3 to 1 if my data is correct even though S&P futures close at the highs........only slightly above the open...I won't be surprised to see selling in O/N session....either way I didn't get add on's today...
I think I may reveise my plan and to sell on the way down if futures can close well below that 78 - 81 zone soon..
I think I may reveise my plan and to sell on the way down if futures can close well below that 78 - 81 zone soon..
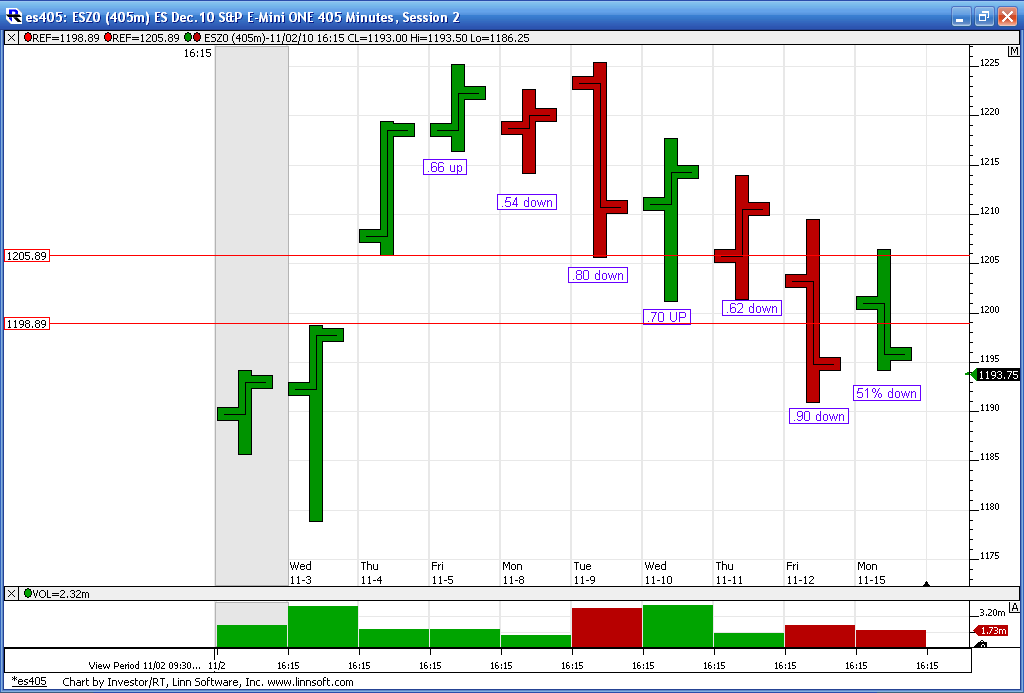
Something to look at. On a 5-min chart. 600 period moving average. It has been support area for prices since the big gap up Sept. 24th.
This is RTH data only, no O/N session included to see the support.
This is RTH data only, no O/N session included to see the support.
I just added to this - SDS at 25.98
Here are some current readings at last weeks close for reference. Along with the symbols on stockcharts.com. I realize that just because things are overbought or oversold it doesn't mean they can't keep going up/down. In general it would be safer to get in the market once these indicators begin to turn down...for the short side to win out.
$BPNYA - NYSE stocks % Bullish (> 70 = bearish, <20 = bullish) - Current reading is 74.9%
$bpspx - S&P 500 % Bullish (same extremes) - Current reading is 79.20
$NYA200R - % of NYSE stocks above 200 day MA ( same extremes) - current reading is 80.33%
$NYA50R - NYSE % above 50 day ma ( >80 = bearish, <20 = bullish)
current reading is 87.84 %
$SPXA50R - SP % above 50 day ma (same extremes as NYSE) current reading 88.6%
I suggest that those interested go to stockcharts and view these indicators from a historical view. It seems logical that things need to correct down in order to create better buying opportunities but when this will happen is the tricky part.
for sentiment I look here:
http://www.schaeffersresearch.com/streetools/market_tools/investors_intelligence.aspx
Ideally you'd like to see the bullish percent over 50 while the bearish percent is below 20. Some divide the bullish percent by the bearish percent and any reading over 1.8 begins to define the overbought areas. I'd like to see sentiment a bit more bullish.Some like a 3 to 1 ratio using other measures. For more reading on sentiment you can go here:
http://www.tradersnarrative.com/
and then click on "sentiment" on the right hand side of the main page
some additional items-
$NYAD - advances to declines is diverging bearishly
Now the number one thing we really need to see are some down distribution days on heavy volume, which have not showed up yet! The markets need to show selling but all we get are up days on excessive volume. So I am obviously very early on these SDS purchases and a more conservative trader would look for down days and a turn down in the above indicators.
depending on how ya count them it appears that the $compx has registered at least 4 distribution days.....O'neil thinks that 4 - 6 over a 20 period is enough to turn a bull market into a bear market.....
very subjective these distribution "counts" but we have already erased all the buying from the fed announcement day.
very subjective these distribution "counts" but we have already erased all the buying from the fed announcement day.
Here is a daily chart with Relative volume labeled on the chart.....I have also snapped two horizontal lines where that failed gap is from two weeks ago and the FED announcement. We have accepted prices within and below that zone. An obvious key area if they try to rally it up a bit from here.
Click image for original size
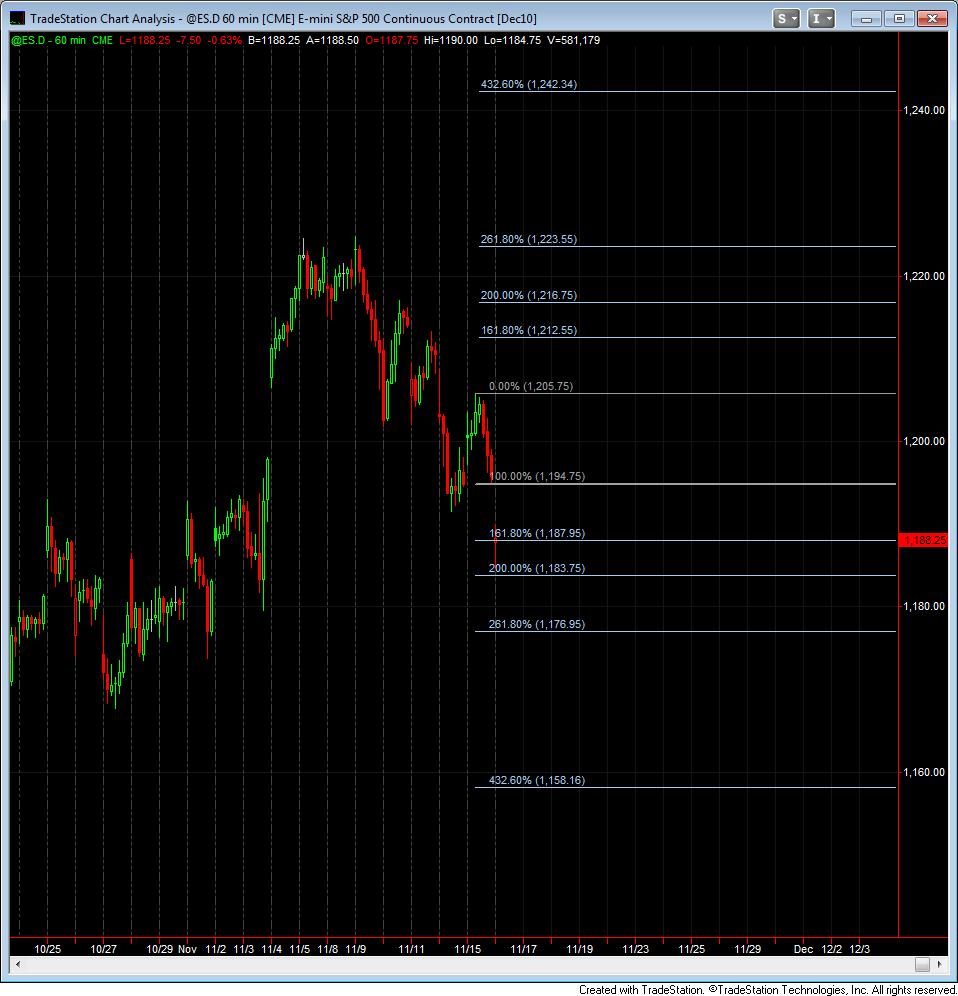
1 pt away from hitting the 2.000 target. Will it touch today or as you suggest Bruce some back fill at higher numbers today.
Click image for original size
Thank you, Bruce!
Emini Day Trading /
Daily Notes /
Forecast /
Economic Events /
Search /
Terms and Conditions /
Disclaimer /
Books /
Online Books /
Site Map /
Contact /
Privacy Policy /
Links /
About /
Day Trading Forum /
Investment Calculators /
Pivot Point Calculator /
Market Profile Generator /
Fibonacci Calculator /
Mailing List /
Advertise Here /
Articles /
Financial Terms /
Brokers /
Software /
Holidays /
Stock Split Calendar /
Mortgage Calculator /
Donate
Copyright © 2004-2023, MyPivots. All rights reserved.
Copyright © 2004-2023, MyPivots. All rights reserved.