Square roots
Hello Mypivots,
As of this writting the High on the ES was 1254. If we take the low this A.M. @ 1243.75 and get the Square root which is 35.26684 and add (since it was a low, If it were a high then I would subtract .146) then I square the number by itself i.e. 35.26684 + .146 = 35.41284 now we square 35.41284 x 35.41284 =1254.06 or 1254 which was this A.M.s first high. I didn't trade since I didn't have another signal. I missed a great short, but I would rather follow my rules then trade on a whim. Also .25 works good and .382.
Todays high 1254, find Square root and subtract .25 and square it is 1236.3 or 1236.5, this may be a good trade since 1256 is another one of my numbers.
Happy trading
Joe
can you post us some charts with your core ideas..? that would be awesome....Is there a way to derive MAJOR square root chart points...I like the concept but with many swings and prime numbers popping up all over I'd like to filter out smaller time frame numbers and see if the higher time frame work better....
I guess my thoughts on this are like fibs...we can find numbers all over the place... but getting to the major numbers seems like it would be of better value.....perhaps you can comment on that too
Good trading Joe and any clarity you can shine down on this is appreciated.
Bruce
I guess my thoughts on this are like fibs...we can find numbers all over the place... but getting to the major numbers seems like it would be of better value.....perhaps you can comment on that too
Good trading Joe and any clarity you can shine down on this is appreciated.
Bruce
Bruce,
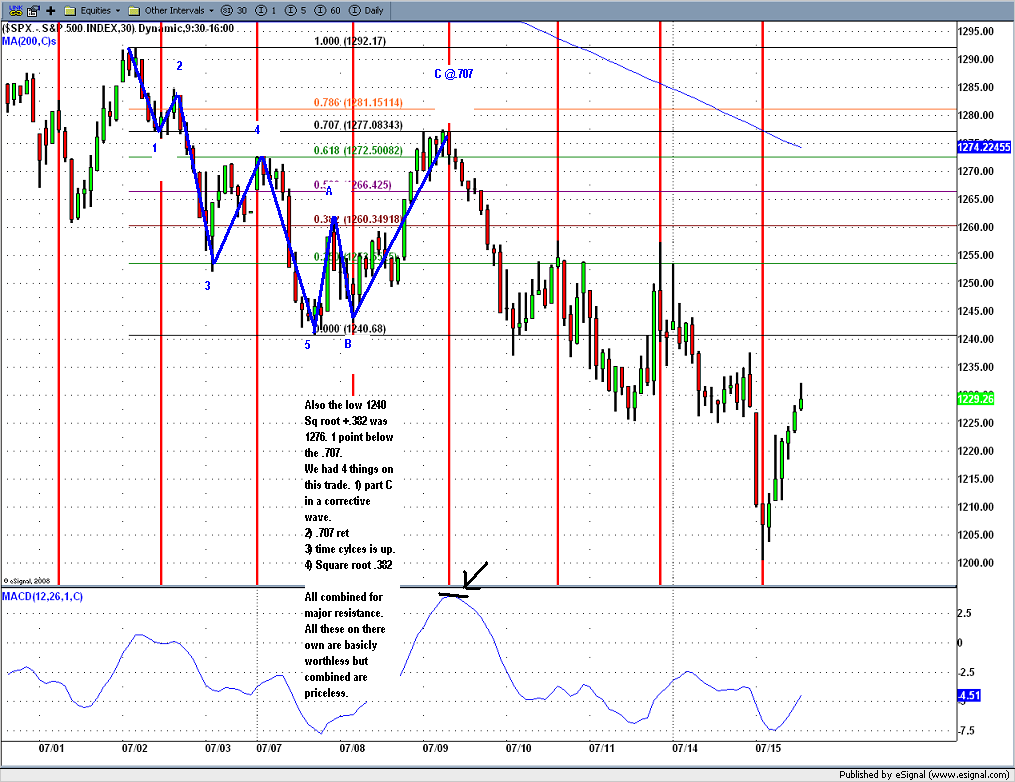
Sq rts is only a small part of what I do, I never use one thing alone. My rules state that If I have A and X lining up then thats a 2 point trade, but If I have an A,X, and a rare Z lining up then I can take 5-10 points very easly. So If I have a Square root lining up with a pivot I take that trade and expect only 2 points. I don't never take a trade soly on Square root and I never take a trade soly on Pivot numbers. Same as you could only take fibos that line up with pivots or anything else that works well, stack the deck in your favour. I am not interested in calling tops and bottoms instead I lowered my profit outlook, i began to scalp and many small profits started pilling up. in the past I used to do like all other traders.....Lets say the market was falling I would but @ .146 and hold for 5 point profit and lose, the same at .25, .386, .5 , .618, and then I would win at .786 but never break even. But if you scalp .146, .25, .386, .5, and .618 you have made much more and the odds are better in your favour. I can't call market tops and bottoms but I can call 5 numbers and one is going to be a bottom but I'll trade all, and I know how much to expect out of every setup.
But you are correct that these are a lot like fibs, they could bottom and could not on a number but when fibs are used like there supposed to be i.e. in a wave count there dynamite and nothing that I know of even comes anywhere close. Anything on its own is no good imho.
happy trading
Oh I rambled on and forgot to answer your question, yes I'll show you some charts with some longer term MAJOR support/resistance.
Click image for original size
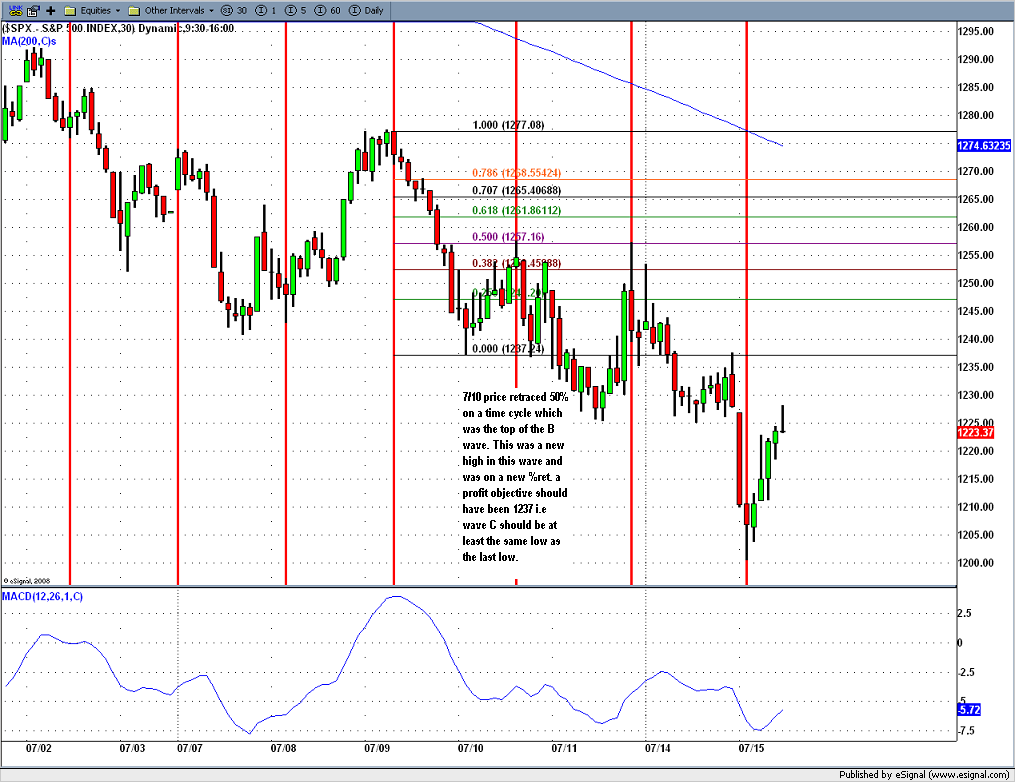
This is where time and price are used together either on there on are little good to the trader.
Click image for original size
Click image for original size
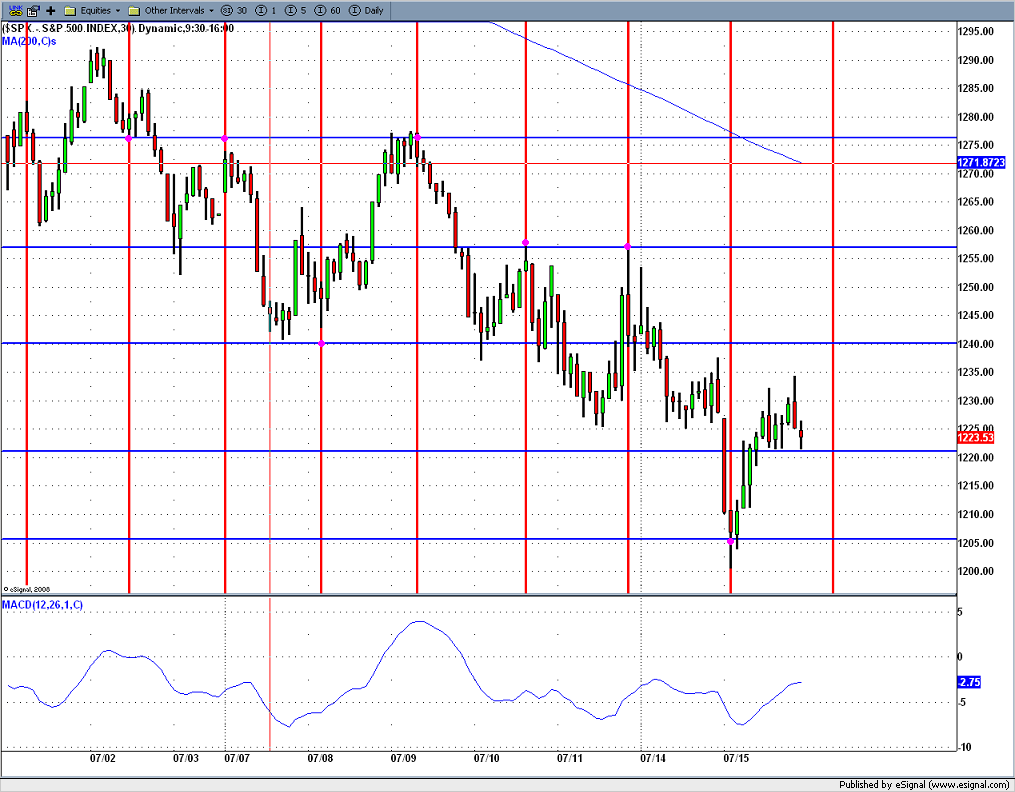
The Blue horizontal lines are Sq root numbers (.5 only) all calculated from the high @ 1292. The red vertical lines are 16 30 min bar cycles. The cyan dots are where time met with price, half are exact and some are a couple of points off. The one this A.M. was 5 points off, but I was expecting that for other reasons on the daily charts...
Hey Joe - thanks for posting your charts and explaining them so clearly.
Thanks Joe. I appreciate the time you took in putting those together. It certainly helps me understand how you trade and I like the confluence in your numbers and time zone work.
Bruce
Bruce
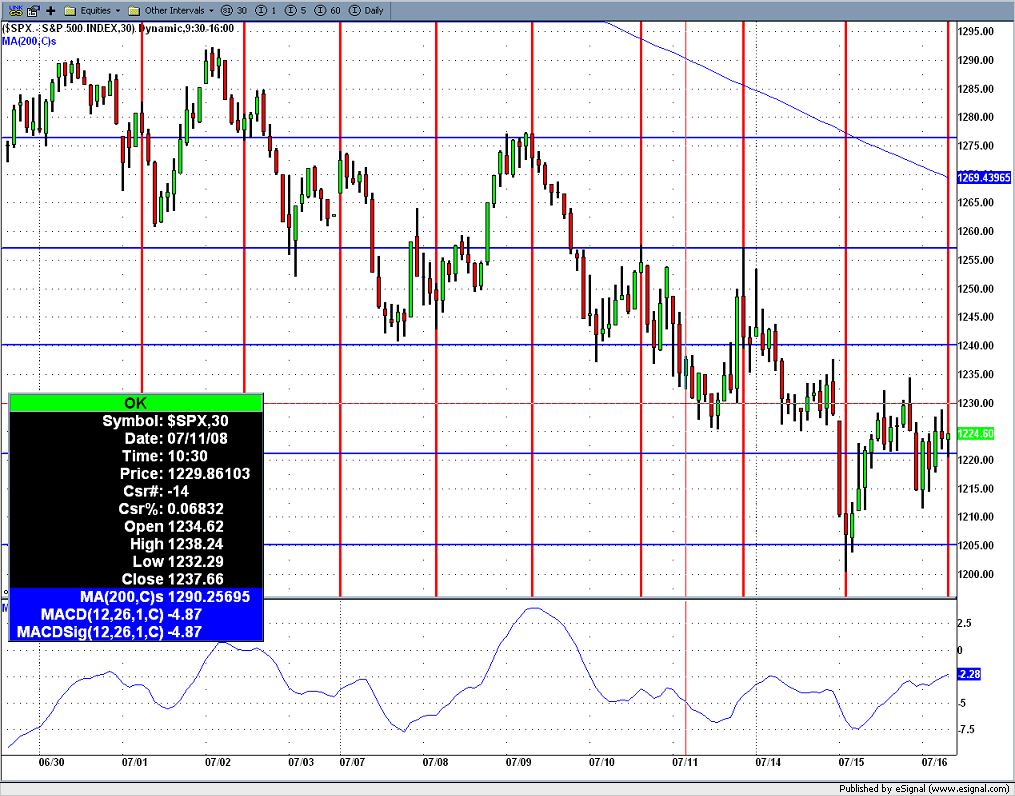
Here is an update chart. At the present the ES is up about 5 points off its low (11:44 low). but since yesterday at 15:00 the SP cash pulled back up off its low 33.91 points whcih is the average pull back since 6/02/08. But maybe that low @ 9:30 was a highier low and we can pull of at least one large ABC wave, maybe to 1245-50. If markets take it out that last low at 9:30 though going by my charts we'll be at 1161 by next thursday.
happy trading
happy trading
Click image for original size
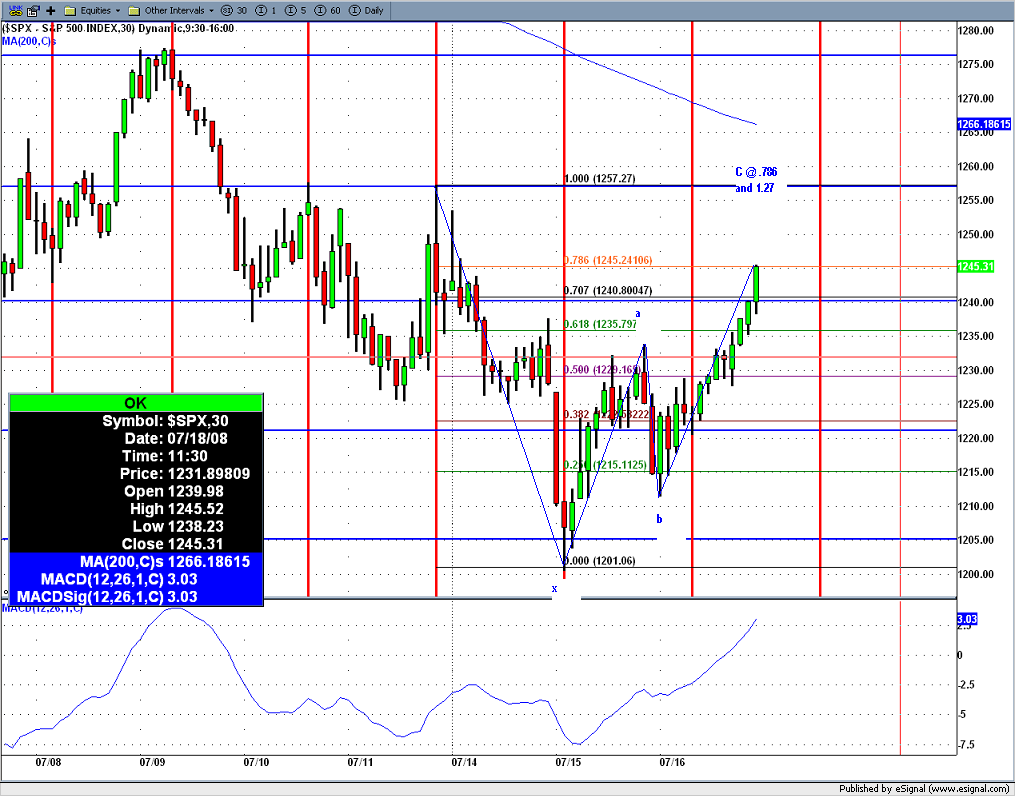
Here's a gartley 222 just a plain ABC elliot wave correction. Setting up real nice. just a little to fast though it should have taken 30 more minitues but close enough.
Click image for original size
Chris,
You did it right, mine may have been human error or typo....but you are doing it right. If my fly fishing ever takes me to Canada I'll take you up on it.
You did it right, mine may have been human error or typo....but you are doing it right. If my fly fishing ever takes me to Canada I'll take you up on it.
Emini Day Trading /
Daily Notes /
Forecast /
Economic Events /
Search /
Terms and Conditions /
Disclaimer /
Books /
Online Books /
Site Map /
Contact /
Privacy Policy /
Links /
About /
Day Trading Forum /
Investment Calculators /
Pivot Point Calculator /
Market Profile Generator /
Fibonacci Calculator /
Mailing List /
Advertise Here /
Articles /
Financial Terms /
Brokers /
Software /
Holidays /
Stock Split Calendar /
Mortgage Calculator /
Donate
Copyright © 2004-2023, MyPivots. All rights reserved.
Copyright © 2004-2023, MyPivots. All rights reserved.