Game Plan for 7/28
Click image for original size
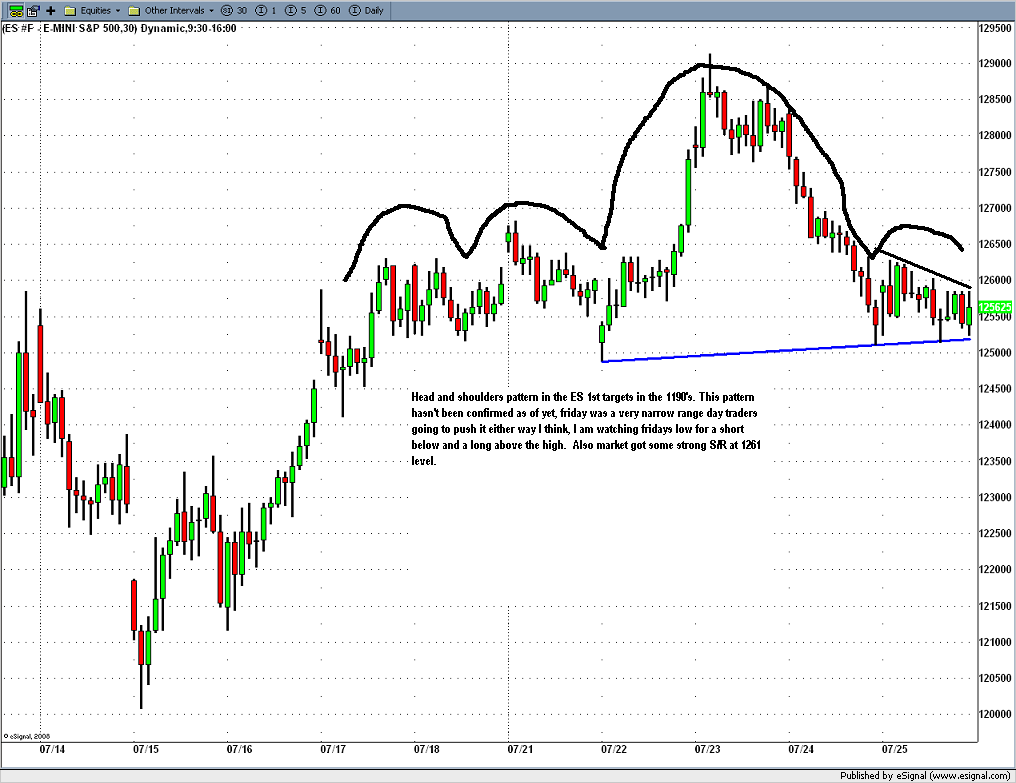
I look for the bear to continue I have some marjor S&R numbers all around 1261 and 1270. But will take either side, I fell tommorow will be a tight day or trending day should be able to tell early on. I am felling like another trending down day like thursday. As I type the markets are only a few ticks from of fridays low
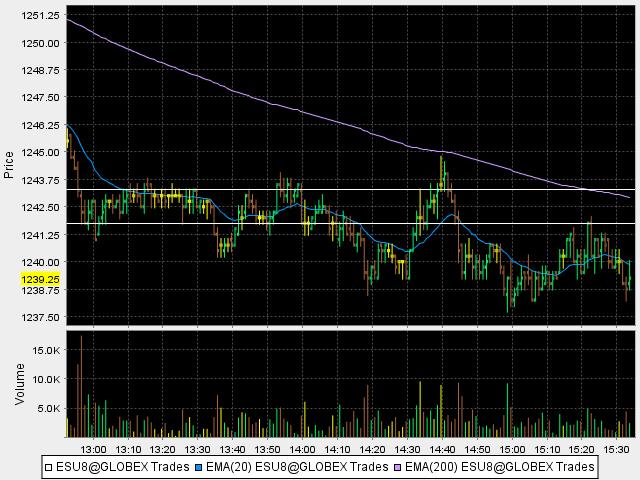
I just got an angry e-mail ( it's been a while) questioning why I post etc etc....While I try to give some ideas in my post as to what I look at it isn't always possible.....I know I ramble at times...lol...in this case I believe the email was not justified as I was demonstrating the high volume areas and also demonstrating PERSISTENCE..( you gotta take the trades and be a PITBULL at times)....so here is a close up of the high volume one minute bar that I snapped at around 12:58 ( see left side of chart) now using this you can see why/how I target the 42 area....I actually exited at 41.75 when it pierced my horizontal line...at around 15:21...then got stopped on runners at entry.....for those who doubt then just don't use the idea but no need to give me *&^% about it
Forums are a crazy place soemetimes...
here is the chart
Forums are a crazy place soemetimes...
here is the chart
Click image for original size
I don't see why anyone would get upset, 1238.25 was a valid entry above support and was well oversold, the market then rallied to the very next strong resistance and sold off which is a given because this is a strong down trend day. One should only expect what the market can give. And I am glad you posted bruce
ohh wrong trade..lol...forget that last reply.
thanks Joe and great call on the game plan for today. Sometimes people expect a lot and when you make a bad call or trade then they want to get on your case. It's easy for some of these folks who aren't "in the ring" everyday to point fingers at people. I'm a bit cranky today for reasons outside of the market anyway and this demonstrates how our thoughts get attracted to "bad things" sometimes....best to keep a good attitude and attract good things. Nice analysis on your part and thanks for all your posts
I think it's good stuff. I'am not angry.
Well thank you for the kind words Bruce, but God alone be the glory
I would have loved to been here at 9:30 and caught that short at 1260, I would have felt better and had more pts so I could carry it to the close
I would have loved to been here at 9:30 and caught that short at 1260, I would have felt better and had more pts so I could carry it to the close
Hey Joe - do you save and use all the weekly and monthly pivots going back to the start of the year? Are prices that are divisible by 9 also significant for you? Thanks for all you posts.
No I don't use old pivots, although I have noticed sometimes the old ones call tops and bottoms from time to time. As far as the "9's" I guess your reffering to the Square of nine? Its also a Sq root calculator...Sq root of 1 + 2(one full rotation around a circle)=9, making one square If you keep going out it turns into large numbers that are natural resistance on the markets and instead of always using 2 i use 1.5, 1, .5, .382, .25, .146, and also "9's" do move the market. from 1200.75 (last major low) to 1291.25 (last major high) was 90 points which is 9 x 10.
Also 9x140=1260 todays top.
9x139=1251 some strong resistance.
9x138=1242 again some strong S/R today.
9x137=1233 todays low.
Also try these numbers divisons of 360...
360+360+360= 1080+180 (360 divided by 2) = 1260 todays low.
1260-11.25=1248.75 a place where the market slowed today and in times past has made nice lows and highs at. Heres a list of 11.25 #'s you can check for yourself 1237.5, 1226.25, 1215, 1203.75.....1271.25, 1282.5, 1293.75, 1305,1316.25 ect ect.
Hi Joe – thanks for sharing your numbers – some of them are the same as mine – here is how I generate them – I use a simple numerical series beginning with 9 where each consecutive number is the previous number + 9
e.g. 9,18,27,36,45,54,63,72,81,90 etc.
If you continue this series, you eventually end with numbers that are within the S&P 500 price ranges.
e.g. 1206,1215,1224,1233,1242,1251,1260
You will recognize 1260 as today’s high and 1233 as today’s low.
May I ask how you derived the ratio .146?
I would really like to learn how to call up-days and down-days in advance, and also learn how to trade based on time alone – as davegemini does in his Day Trade For Today forum. If you or anyone knows where one can learn stuff like this, I will be grateful.
anouska,
If your interested in time I suggest you count bars from low to high to low ect ect over the largest frame that you can. example on the 5 min tops or bottoms happen 40 bars after a top or bottom, 30 min its 16and 32-33 bars. and you can also do daily its 3.5weeks or about 17 trading days. Thats one method of doing it. The other is planets. Aspects with price work very well. If your looking for something short term I sggest you look at the ES and see what it does when the moon goes viod of cource, full and new.
If your interested in time I suggest you count bars from low to high to low ect ect over the largest frame that you can. example on the 5 min tops or bottoms happen 40 bars after a top or bottom, 30 min its 16and 32-33 bars. and you can also do daily its 3.5weeks or about 17 trading days. Thats one method of doing it. The other is planets. Aspects with price work very well. If your looking for something short term I sggest you look at the ES and see what it does when the moon goes viod of cource, full and new.
cool..always good to have many different types of participants near our numbers....I'm watching those singles in the NQ get tested now from yesterday ..certainly don't want to see a 30 minute close below them but this market is weak and NQ/naz is the leader today
Emini Day Trading /
Daily Notes /
Forecast /
Economic Events /
Search /
Terms and Conditions /
Disclaimer /
Books /
Online Books /
Site Map /
Contact /
Privacy Policy /
Links /
About /
Day Trading Forum /
Investment Calculators /
Pivot Point Calculator /
Market Profile Generator /
Fibonacci Calculator /
Mailing List /
Advertise Here /
Articles /
Financial Terms /
Brokers /
Software /
Holidays /
Stock Split Calendar /
Mortgage Calculator /
Donate
Copyright © 2004-2023, MyPivots. All rights reserved.
Copyright © 2004-2023, MyPivots. All rights reserved.