ES 8-18-08
PH looks like it'll hold as buying support after this 2 point pullback. I'm targeting a technical double top at the run's high, a managable pullback, and then a run for 1320. The 13 period ATR is 22.79, the extreme of which at the upside from the base is 1316.79.
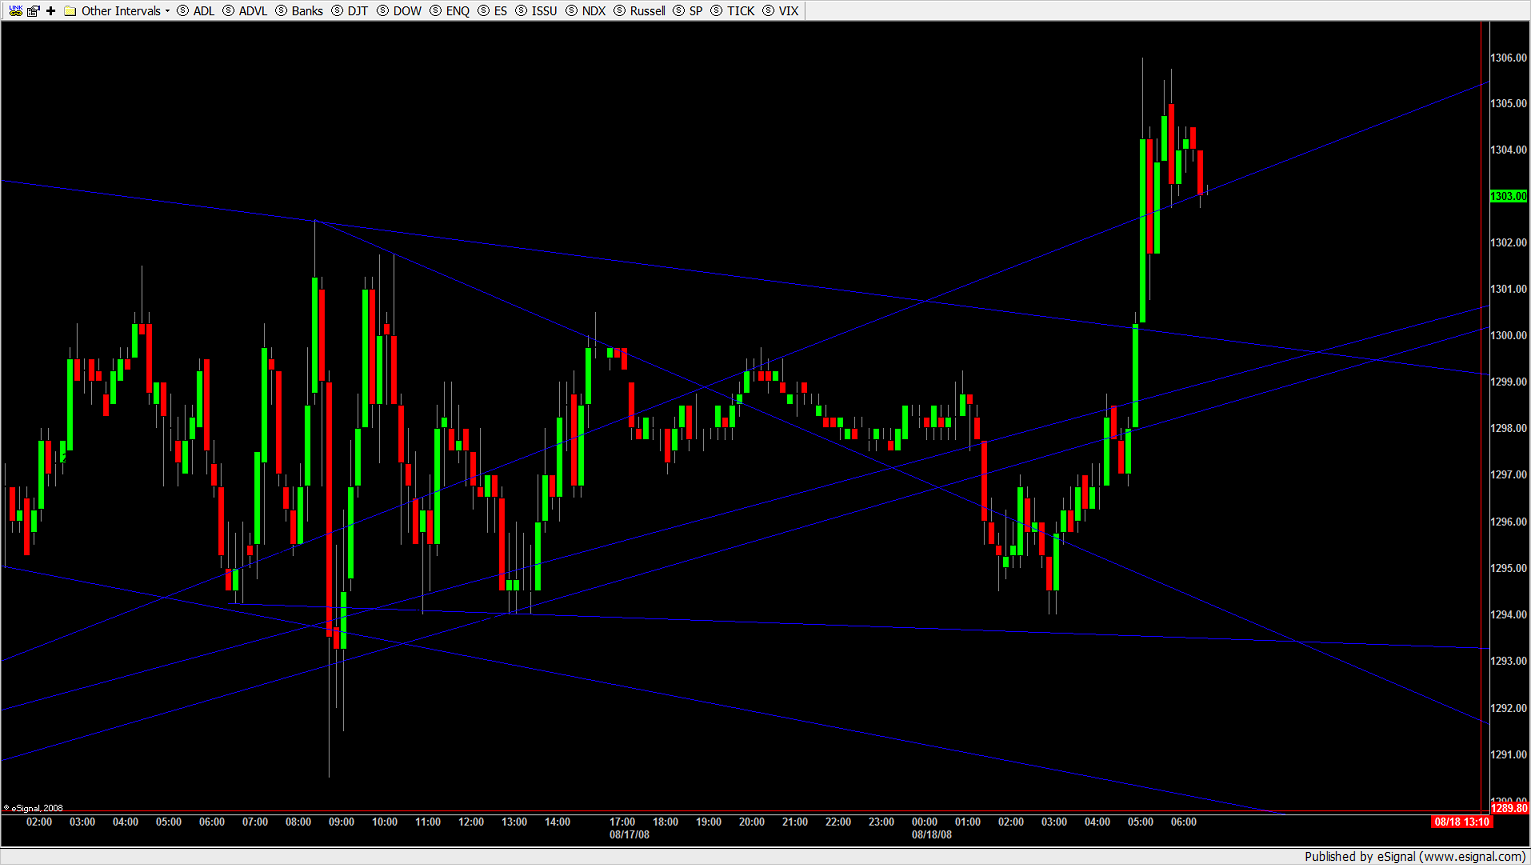
Unreal..
Look at this and see if you can spot the exact point where the bull should have ended:
Unreal..
Look at this and see if you can spot the exact point where the bull should have ended:
Click image for original size
i have my sell goggles on today...1306 is a monthly number..just about skinned it in the overnight
Make no mistake about it,we are in a bear market.We could still achieve 1320-1330 and not violate the trendline of the best example of a rising wedge (basis daily charts)that i have seen in a long time.When u add in the volume and most nyse new lows in history at the recent July 15 bottom,a retest of it ,at a minimum, seems compelling.Will we? When? Who knows, but history says thats an 80% probability, and in this game we love you wont get much better than that.In the meantime, ill be scalping longs and shorts.
Take care friendsfor we have already had a 12 point range equalling fridays range and the day hasnt even started yet! Sweet nectar volitility! By the way , anyone notice that that the rcent decline from 1440 took 40 daily bars and a .618 correction of that is 24. Tuesday is day 24. Perhaps the hurricane thats about to blow me away (which hits tues.) is a more ominus sign than i like to admit! lol
Hey Kool, can you tell me where I can find that 80% statistic...I have some core stocks (longs) working and I'm curious as to where that stat comes from..thanks...
quote:
Originally posted by koolblue
Make no mistake about it,we are in a bear market.We could still achieve 1320-1330 and not violate the trendline of the best example of a rising wedge (basis daily charts)that i have seen in a long time.When u add in the volume and most nyse new lows in history at the recent July 15 bottom,a retest of it ,at a minimum, seems compelling.Will we? When? Who knows, but history says thats an 80% probability, and in this game we love you wont get much better than that.In the meantime, ill be scalping longs and shorts.
A measured move from this last, whatever you want to call it, is at 1316, and it just broke the ledge. I'm long here for now.
Its all over the net , but most ly from a respected analyst named Carl swenlin and an expensive advisory i used to follow called Marketcharts/ market turns.They go back years with data n have an incredible following among institutions
Lots of resistance 1309-1311 SPQR, Dont overstay your wellcome.
Hey, Bruce, google jim curry, cycles and maybe you can learn more. Ithink they may have some sort of free trial.Incidently gang, today im doing atrial on a advisory service called pagetrader and for what its worth , there resistance areas are [Admin Edit - text removed]. VERY SIMILAR TO MINE.(REFER TO PAST POSTS)
5 MIN CHART PROJECTING 1293.25.i MAY JOIN U SOON SPQR!
Above opinion is mine not pagetraders!THEY dont open till 9:30
In this topic you'll see a few "[Admin Edit - text removed]" where I've removed some proprietary PageTrader information that koolblue posted. I'd like to remind everyone that you can't re-post proprietary information from subscription services unless they explicitly give you permission to do so. It's against the law and we follow the law on this forum. If you want to do that then please make sure that you have their explicit written permission first and contact me with the details of that permission before you do so.
If you have any questions about what is or is not allowed then drop me a line before you post it and I'll make a decision on it.
As always, continue to send me an email if you see something on the forum that you don't think should be here. Thanks for understanding and helping to keep this forum high quality and legal.
Emini Day Trading /
Daily Notes /
Forecast /
Economic Events /
Search /
Terms and Conditions /
Disclaimer /
Books /
Online Books /
Site Map /
Contact /
Privacy Policy /
Links /
About /
Day Trading Forum /
Investment Calculators /
Pivot Point Calculator /
Market Profile Generator /
Fibonacci Calculator /
Mailing List /
Advertise Here /
Articles /
Financial Terms /
Brokers /
Software /
Holidays /
Stock Split Calendar /
Mortgage Calculator /
Donate
Copyright © 2004-2023, MyPivots. All rights reserved.
Copyright © 2004-2023, MyPivots. All rights reserved.