ES 8-20-08
ES is as I type down 50cent, they were up about 6 bucks in the overnight. I would have perferred a gap up since we've been down 50.75 points since the 1313.5 high on 8/11. I think this is going to add volitilty to the early morning trading.
thx,Spqr
Click image for original size
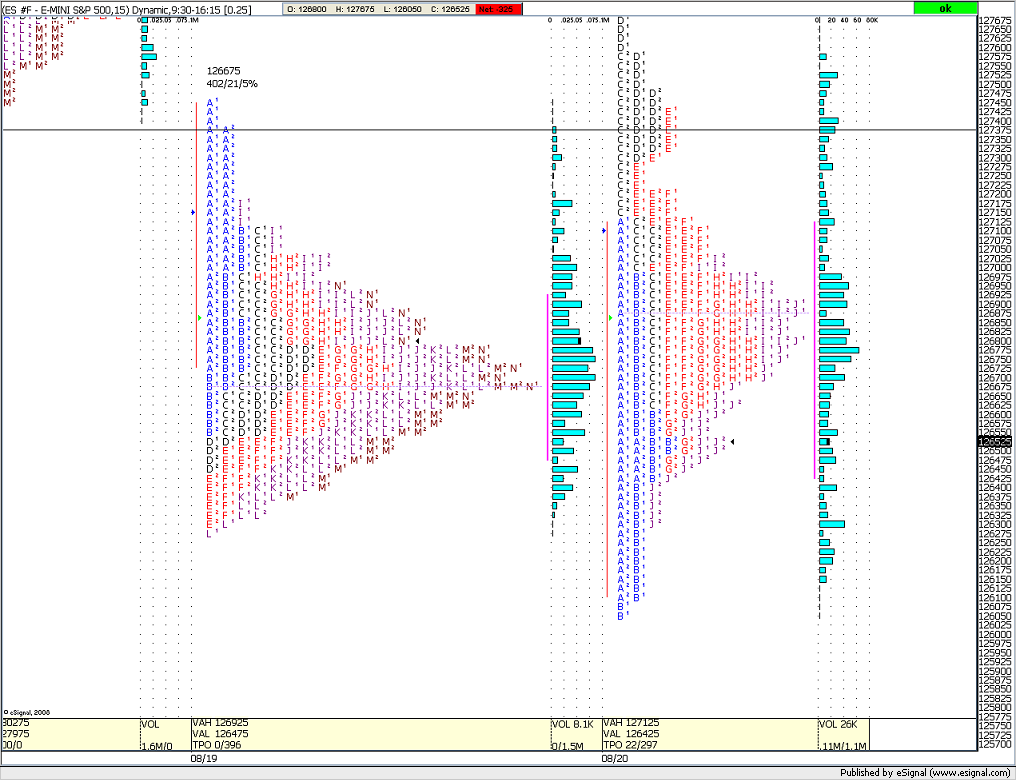
Once again price was rejected out of value in the J, E and F's. And also were in the K's now
it would be real cool to see them fill in the missing teeth above your F period highs....up in 72 area.....bears really getting frustrated with this old 64 number...perhaps they'll finally cut them some slack and give it up for more than a 1/2 hour
That's one hell of a strong looking third wave to the upside. Let's see how strong sellers' fifth wave is. They're trading punches now.
And nice call, Bruce and Joe. I've some catching up to do in MP. You guys made me decide I need to pony up.
And nice call, Bruce and Joe. I've some catching up to do in MP. You guys made me decide I need to pony up.
Ill sell 1273.75 and hold overnite if we can get there. Cant scalp, due to my trading rules.
1273.5 is Sq root off last low @ 1263.
We're in the triangle again. I've a primary bull having completed working on 3 premium prices to the upside. 73.50 might pull back for a few handles but it will be beaten. A tight stop will lose you money... When this measured move ends, I'll forecast the breakout, and the move further dooooooooooooown...
gotta go- order cancelled.
and that is why we love the profile...so cool.....ya just can't see that stuff on a regular chart...and nice hit on your 73 Joe too
Bruce,
I was just saying the exact same thing to my Dad. There's just no way you can see these set-ups in a traditional bar or candle stick chart. Also patterens are much easier to remember than a bar chart.
I was just saying the exact same thing to my Dad. There's just no way you can see these set-ups in a traditional bar or candle stick chart. Also patterens are much easier to remember than a bar chart.
quote:
Originally posted by Printer
Here is a web site that has the square of nime numbers for popular futures contracts
http://www.imtc.com/cci/square_of_nine_index.htm
Printer
Thanks Printer
Emini Day Trading /
Daily Notes /
Forecast /
Economic Events /
Search /
Terms and Conditions /
Disclaimer /
Books /
Online Books /
Site Map /
Contact /
Privacy Policy /
Links /
About /
Day Trading Forum /
Investment Calculators /
Pivot Point Calculator /
Market Profile Generator /
Fibonacci Calculator /
Mailing List /
Advertise Here /
Articles /
Financial Terms /
Brokers /
Software /
Holidays /
Stock Split Calendar /
Mortgage Calculator /
Donate
Copyright © 2004-2023, MyPivots. All rights reserved.
Copyright © 2004-2023, MyPivots. All rights reserved.