ES 8-25-08
The measured move is surpassed without making a higher high and has fulfilled three descending premium prices from 94. I've a day limit at price short at the open targeting 80 even for 12.25 points, using a 4 point stop.
The false bull was a B wave pullup in a bear controlled double zig-zag ABC whose measured move would come in at 1220.25, breaching the bull's second wave, where bears were satisfied at 1231.50. It's too early to tell if a bounce from 20 will be a bonifide 3rd wave of the bull or a failed attempt leading to new bear market lows. I strongly suspect bull head-fakes all the way down from here to a double bottom at 1200.75 and then a bear exahustion move until it irons out to create a bottom. It's been one hell of a bull run. I'm targeting 1140 when I decide to get longer-term. I want to see what the bull bounce does however.
First thing's first though; bears have to hold 80 even.
interesting, i sold the open also but only for a scalp. covered 2 at 1289.50.As you may be aware, im looking for a retest of 1200 also .ITshould be pointed out to all that if we turn south from this area it will be what is called the "kiss of death" which is when a triangle or rising wedge breakout occurs and we rise back up to kiss the trendline that was broken,and turn south again.
My concern would be that ,from a cyclic perpective, the 120 day cycle which bottomed on July 15 should provide some support for the bulls untill early SEPT. An ideal fib. and cycle anal. would have a peak of some sort on or near Sept.9 and down hard into SEPT.15 OR 16TH. Iwould never advise trading only on cycles, however. SPQR, is there no chance this run up from July is a 4th wave retracement(specifically wave a, then b down and finally c up to final resolution around 1325 to 1332, before the real decline sets in? Or that the decline from 1576 to 1200 was a large a b c d e correction and that this rise from july is a b wave up(note the poor volumne!)and c takes us down soon to a retest or more likly new price lows? Your thoughts would be greatly appreciated.
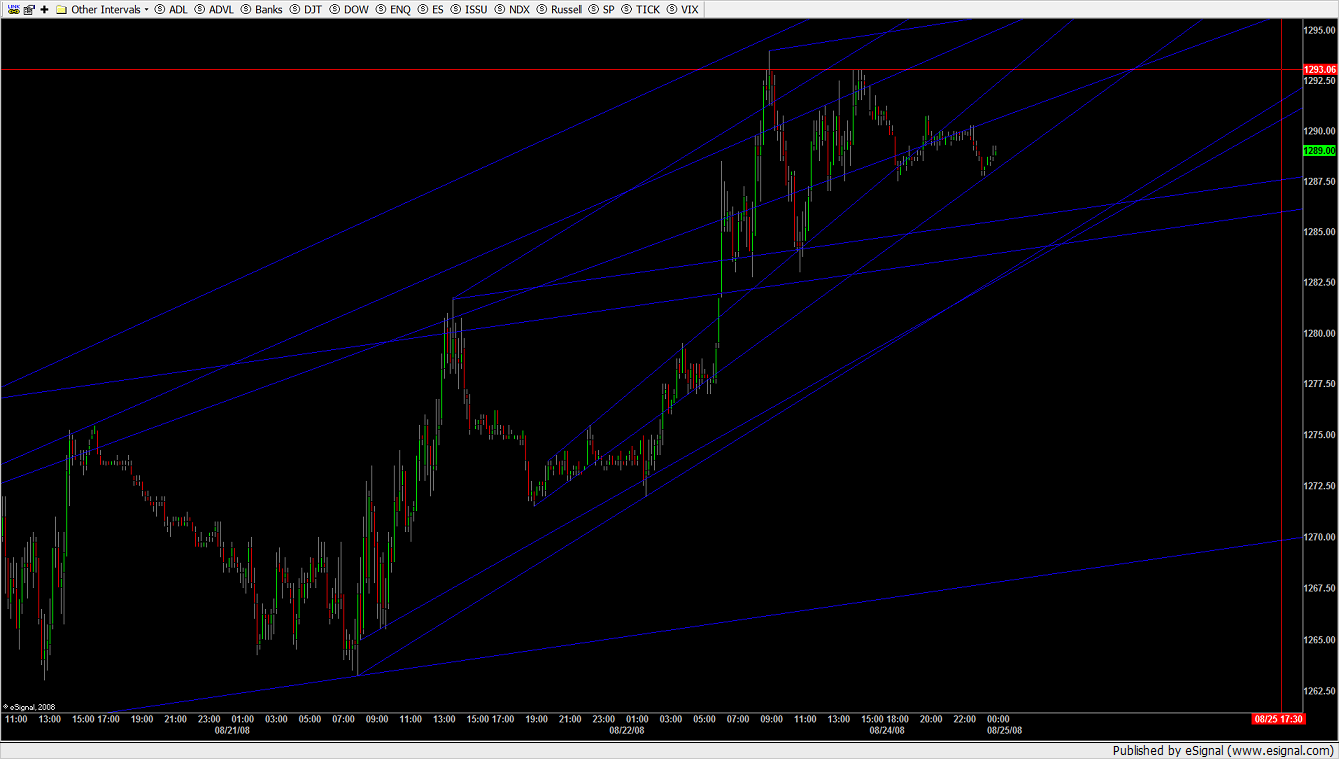
It occured to me that the move before lunch Friday could have been an irregular A wave off of the 5th, the B wave rally after lunch and this could be the C wave. If so we could expect a test of the before lunch low of 83 but buyers are trying to hold their trend lines pretty well, and the overthrown starting 3rd wave channel that proved for a good bounce off of a falling knife at R1 comes in ascending now at 85.75. Buyers are trying to take off here at the 88s but are having trouble. The 377 is resistance temporarily and coincidentally buyers are hung up at the 62% from 1306 they surpassed Friday. It's been my observation after a measured move of the first 5 primary waves a correction of the entire run top to bottom occurs. I plan to stay up long enough to cover at 85.75 simply because I'm not GTC and I'm tired. But that explosive upside trend Friday created a continuation sell signal on surpassing the squeeze that fired the sell from 1306. It'll take a full-blown divergence to get strong enough to retrace up considerably. Believe it or not by my 5000T the momentum down hasn't even started to dump yet. The 80 target I came up with is a measured move from 1306 but a 50 fib comes in at 77. I think we'll bounce at 85.75 to correct 90 and then set to take out the trendline to put in a bonifide 2nd wave and create another trendline if it's a bull, or a failed bounce if it's not.
82 or lower today isn't only probable, but likely. I agree with you though, a bear market or not we'll get a strong bounce into the primary 2nd wave's channel, but only after it's lost, and it will be lost. A 2nd wave impulse has to be put in if it's a bull or no. It's a matter of how convincing the 3rd wave attempt will be. At this point it's in the best intrerest of buyers to lose it on purpose to create a bottom with minimal catipulation. Value is value but 1140 from a measured move from 1441 would be 28% of the entire index from 1586. You know what I mean? I mean we all love value but you need operating bluechips for it to mean a damn.
82 or lower today isn't only probable, but likely. I agree with you though, a bear market or not we'll get a strong bounce into the primary 2nd wave's channel, but only after it's lost, and it will be lost. A 2nd wave impulse has to be put in if it's a bull or no. It's a matter of how convincing the 3rd wave attempt will be. At this point it's in the best intrerest of buyers to lose it on purpose to create a bottom with minimal catipulation. Value is value but 1140 from a measured move from 1441 would be 28% of the entire index from 1586. You know what I mean? I mean we all love value but you need operating bluechips for it to mean a damn.
Click image for original size
Truth be told I don't have enough historic data to study the waves prior to 1586 in their entirety. If this move down is a C wave of an irregular correction, and going on the A wave's action, which so far has been mimed, is any indication, what we've seen from the likes of this bull run will be about the extreme to the upside. I don't expect to see a correction of 1441 until a bottom's in. And at 1200 and below, there's nothing in the way of support or price satisfaction save tight range exhaustion moves from the bull. There wasn't price satisfaction from this bounce up save to correct a few legs. For 1320 to be hit we need a double bottom at 1200, and imho, those are some monstrous odds.
I'm not up on my cycles, Koolio. I chose Elliot over Hurst first. If it aint broke..
I'm not up on my cycles, Koolio. I chose Elliot over Hurst first. If it aint broke..
Covering at 86 pivot, reversing to 90 2 point stop. Off to bed. Good luck tomorrow guys.
Order in to buy(scalp) 1286.25, 2 point stop.
Order cancelled(for now), taking a nap.
buy scalp 2 at 1284.25,3 point stop
covering both at 1286.00
1286 not hit covered both at 1285.50. Up 5.5 handles due to a short scalp on the globex open.
Thanks Joe
Emini Day Trading /
Daily Notes /
Forecast /
Economic Events /
Search /
Terms and Conditions /
Disclaimer /
Books /
Online Books /
Site Map /
Contact /
Privacy Policy /
Links /
About /
Day Trading Forum /
Investment Calculators /
Pivot Point Calculator /
Market Profile Generator /
Fibonacci Calculator /
Mailing List /
Advertise Here /
Articles /
Financial Terms /
Brokers /
Software /
Holidays /
Stock Split Calendar /
Mortgage Calculator /
Donate
Copyright © 2004-2023, MyPivots. All rights reserved.
Copyright © 2004-2023, MyPivots. All rights reserved.