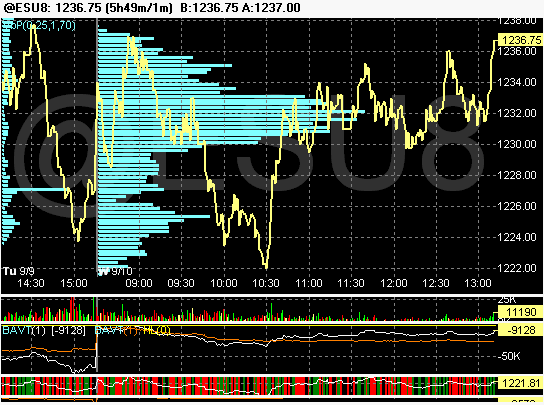
ES 09-10-08
fixed Sq 9
1297
1279
1261
1243
1225
1208
1191
1174
Dated Sq 9
1283
1267.5
1247
1232
1212
1198
I'll post $PREM buy and sell programs in the A.M.
1297
1279
1261
1243
1225
1208
1191
1174
Dated Sq 9
1283
1267.5
1247
1232
1212
1198
I'll post $PREM buy and sell programs in the A.M.
80% in effect...targeting 69 long @ 41.5
prestwick you can post images by first clicking the reply to topic icon found at the top of each post, it looks like a paper with a purple arrow on it, once clicked a new window will open where you enter your post. then at the bottom where you see "attach file" you want to click upload, this will open another window where you enter the title for the chart, browse for the image and click ok, then you want to tick the circle at the bottom where it says "members" make sure that says share.
When you guys watch $TICK are you counter trend i.e. selling @ +1000 and buying at -800 -1000. Or are you trend trading looking for higher highs in both the tick and ES and divergances?
This last high we had at 1244 was with high $tick count the highest in a couple of days....
quote:
Originally posted by CharterJoe
When you guys watch $TICK are you counter trend i.e. selling @ +1000 and buying at -800 -1000. Or are you trend trading looking for higher highs in both the tick and ES and divergances?
I calculate the 3 hour price oscillators for both $tick and /es, each will read 1 at new 3 hour high and -1 at new 3 hour low and 0 for example if it is in middle of 3 hour channel and so on. Then I subtract the /es osc from the $tick osc. This gives me a reading I have found more useful. If anyone here is using thinkscript (tos) or wants to see the code I'd be glad to share.
P.S. I view this all on a 1min chart.
TY for the instructions.
Her is what I told to Pop and Joe in the email:
Here is where the BAV study can help. Big money bought about 20k net contracts off of the low today while small $ was essentially flat. Big $ has been playing around in the 29.5-35.5 range letting the market down and net accumulating. They will slam this and cause small $ to chase. Watch out for the unfulfilled 80% rule today to the 60.0 area.
Well, I screwed up somehow. Perhaps Joe or Pop weill post the chart. Sorry about that.
buying here...1236.75
long 2 @1237.00,covered one at 1238.00... long one
covering around1241
quote:
Originally posted by BruceM
Dt any suggestions on how to get all the GEMs from each day ( when applicable ) to a place where some of your readers will find it...?
Someone searching for ideas on the $tick for example will probably not think to look through all these daytrading posts...
Bruce - I echo your sentiment. I've been doing some research on that and there seems to be 2 things that we need to do to accomplish that. One is tagging: e.g. tag someone's post with the words $tick and ES for example. The other other is voting for the post: thumbs up/down. That way you can look at all the posts tagged with $tick in order of popularity.
It won't be available for some months but I'm working with the guys who are working on the new software for the forum and eventual I hope that those ideas will make their way in here.
Emini Day Trading /
Daily Notes /
Forecast /
Economic Events /
Search /
Terms and Conditions /
Disclaimer /
Books /
Online Books /
Site Map /
Contact /
Privacy Policy /
Links /
About /
Day Trading Forum /
Investment Calculators /
Pivot Point Calculator /
Market Profile Generator /
Fibonacci Calculator /
Mailing List /
Advertise Here /
Articles /
Financial Terms /
Brokers /
Software /
Holidays /
Stock Split Calendar /
Mortgage Calculator /
Donate
Copyright © 2004-2023, MyPivots. All rights reserved.
Copyright © 2004-2023, MyPivots. All rights reserved.
