$tick/vol
I'm just putting this here so I don't lose it...it's a repeat from a daytrading thread
Here is the basic concept for me :
I'm looking at volume and $ tick extremes...preferably in the first 90 minutes.....a volume spike is more important to me than the $tick but prefer to see the extremes together.....that usually means over 800 on the $tick on the high side and minus 600 - 700 on the downside
I'm looking for the extremes to hit on the volume into a key number....I want to know if the volume is attracting more of the same...or if capitulation has just happened...even if on a short term basis...
This makes good technical sense because we have the following:
1) a key number where many are watching
2) a spike in volume to show that people are interested at the key level mentioned in bullet #1
3) a $ tick extreme for more evidence that an extreme may be in
As you know I'm a fader so I'm watching to see if the volume is being accepted or rejected......when you think about it this happens at all prices...they will be
a) Rejected fast and the market will retrace
b) Accepted fast and the market keeps going
c) accepted or rejected slowly
These volume spikes become magnest for the current session and future sessions...the idea being that if the price was attractive to give a volume spike then some big players where there to creat the volume spike....
I watch the one minute for these......
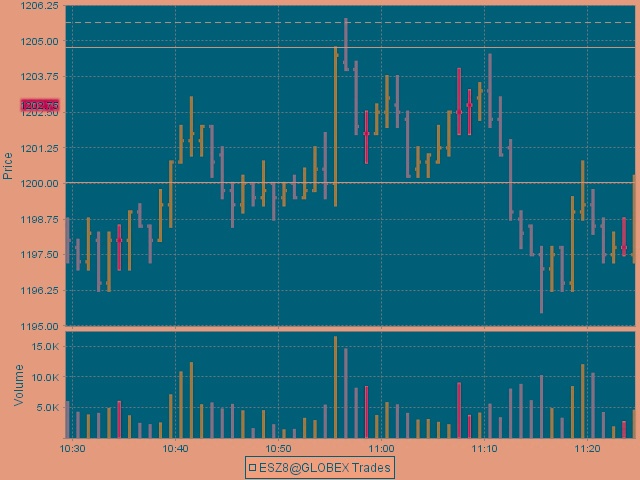
As I'm typing we have a volume spike at the 1200 - 1204. area today...and we are testing it after we rejected it earlier...
If you are watching these outside of the 90 minutes and the "Window " strategy...see the pitbull threads for that then you need to fiqure out if they will reject it there or accept it...look at yesterdays 1212 number...the general theory states that the more time is spent at the number then the more participants are ok with it and aren't repositioning off it as fast as they did before....
Ok..this is a start......
here is the chart that shows the spike
Here is the basic concept for me :
I'm looking at volume and $ tick extremes...preferably in the first 90 minutes.....a volume spike is more important to me than the $tick but prefer to see the extremes together.....that usually means over 800 on the $tick on the high side and minus 600 - 700 on the downside
I'm looking for the extremes to hit on the volume into a key number....I want to know if the volume is attracting more of the same...or if capitulation has just happened...even if on a short term basis...
This makes good technical sense because we have the following:
1) a key number where many are watching
2) a spike in volume to show that people are interested at the key level mentioned in bullet #1
3) a $ tick extreme for more evidence that an extreme may be in
As you know I'm a fader so I'm watching to see if the volume is being accepted or rejected......when you think about it this happens at all prices...they will be
a) Rejected fast and the market will retrace
b) Accepted fast and the market keeps going
c) accepted or rejected slowly
These volume spikes become magnest for the current session and future sessions...the idea being that if the price was attractive to give a volume spike then some big players where there to creat the volume spike....
I watch the one minute for these......
As I'm typing we have a volume spike at the 1200 - 1204. area today...and we are testing it after we rejected it earlier...
If you are watching these outside of the 90 minutes and the "Window " strategy...see the pitbull threads for that then you need to fiqure out if they will reject it there or accept it...look at yesterdays 1212 number...the general theory states that the more time is spent at the number then the more participants are ok with it and aren't repositioning off it as fast as they did before....
Ok..this is a start......
here is the chart that shows the spike
Click image for original size
not sure why the chart isn't posting...
well I'll get to the chart later but you can see how the zone of volume become resistence and then it became support to the next volume number up in the 1212 area.....
DT are you here? Charts are goofing me up today...
DT are you here? Charts are goofing me up today...
Emini Day Trading /
Daily Notes /
Forecast /
Economic Events /
Search /
Terms and Conditions /
Disclaimer /
Books /
Online Books /
Site Map /
Contact /
Privacy Policy /
Links /
About /
Day Trading Forum /
Investment Calculators /
Pivot Point Calculator /
Market Profile Generator /
Fibonacci Calculator /
Mailing List /
Advertise Here /
Articles /
Financial Terms /
Brokers /
Software /
Holidays /
Stock Split Calendar /
Mortgage Calculator /
Donate
Copyright © 2004-2023, MyPivots. All rights reserved.
Copyright © 2004-2023, MyPivots. All rights reserved.