Square of nine's
871
886
901
916
931
946
961
977*
993
1009*
1025
1041
1057
1089
1106
1123*
1140
1157
1174
1191
1208
1225
1243
1261
1279*
1297*
1315
1333
1351
1369
1388
1407
1426
1445
*=these carry more weight since they are also primes.
886
901
916
931
946
961
977*
993
1009*
1025
1041
1057
1089
1106
1123*
1140
1157
1174
1191
1208
1225
1243
1261
1279*
1297*
1315
1333
1351
1369
1388
1407
1426
1445
*=these carry more weight since they are also primes.
Click image for original size
charterjoe
another ploy that you might consider using is doing a fib ratio of 1.13 and 1.272 from previous significant high or low (the extreme of fib 1.618)
that will give you a 'box' and a probable retracement (it also creates an isosceles triangle)
there are software vendors charging outrageous money for that small piece of information
good luck
Click image for original size
Sq of nine numbers for ZB treasury bonds. I did this in the manner that CharterJoe explained. I think I got them right.
87-3
88-19
90-3
91-19
93-3
94-19
96-3
97-22 *
99-10
100-29 *
102-16
104-3
105-22
108-29
110-19
112-10 *
114-0
115-22
117-13
119-3
120-26
122-16
124-10
126-3
127-29 *
129-22 *
131-16
133-10
135-3
136-29
138-26
140-22
142-19
144-16
87-3
88-19
90-3
91-19
93-3
94-19
96-3
97-22 *
99-10
100-29 *
102-16
104-3
105-22
108-29
110-19
112-10 *
114-0
115-22
117-13
119-3
120-26
122-16
124-10
126-3
127-29 *
129-22 *
131-16
133-10
135-3
136-29
138-26
140-22
142-19
144-16
http://www.imtc.com/cci/sqof9-Super.htm
Here is a large square of nine. I only use the numbers in yellow...
Here is a large square of nine. I only use the numbers in yellow...
Great link Joe! Thanks.
Click image for original size
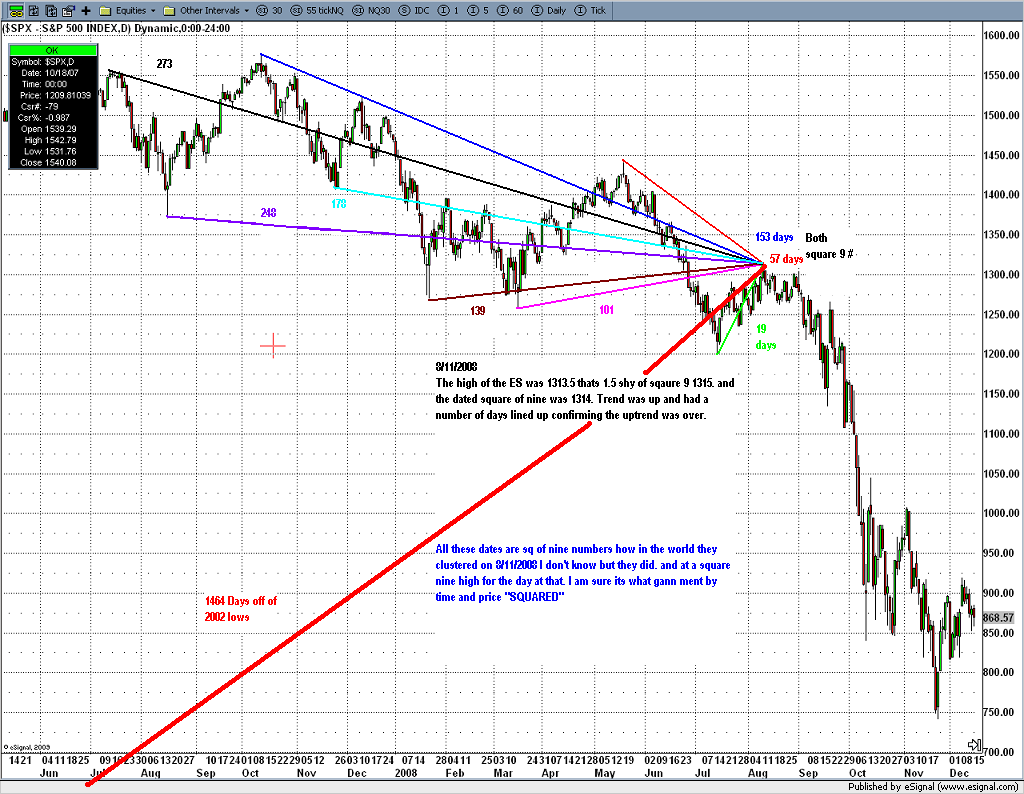
And not totting my horn...by no means just wanting to show this is NOT HINDSIGHT but was aware of before hand here is a post on this chat room in the thread fib ma's
www.mypivots.com/forum/topic.asp?TOPIC_ID=3155&SearchTerms=trends,over
look at my blue chart...
Click image for original size
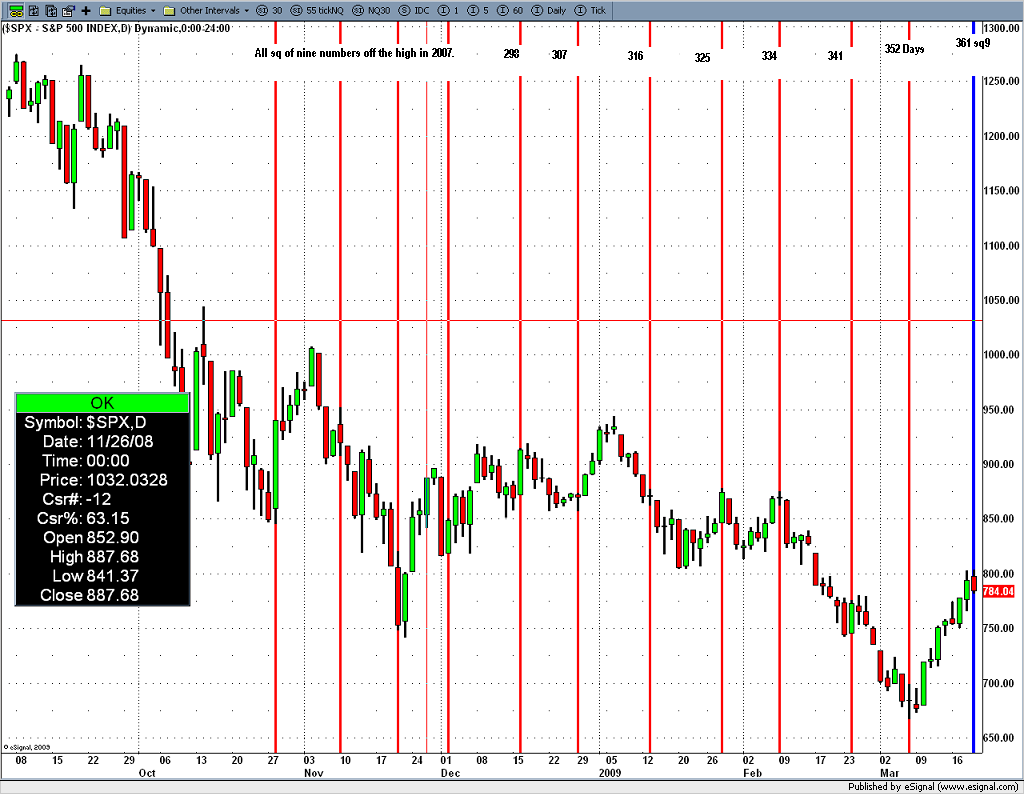
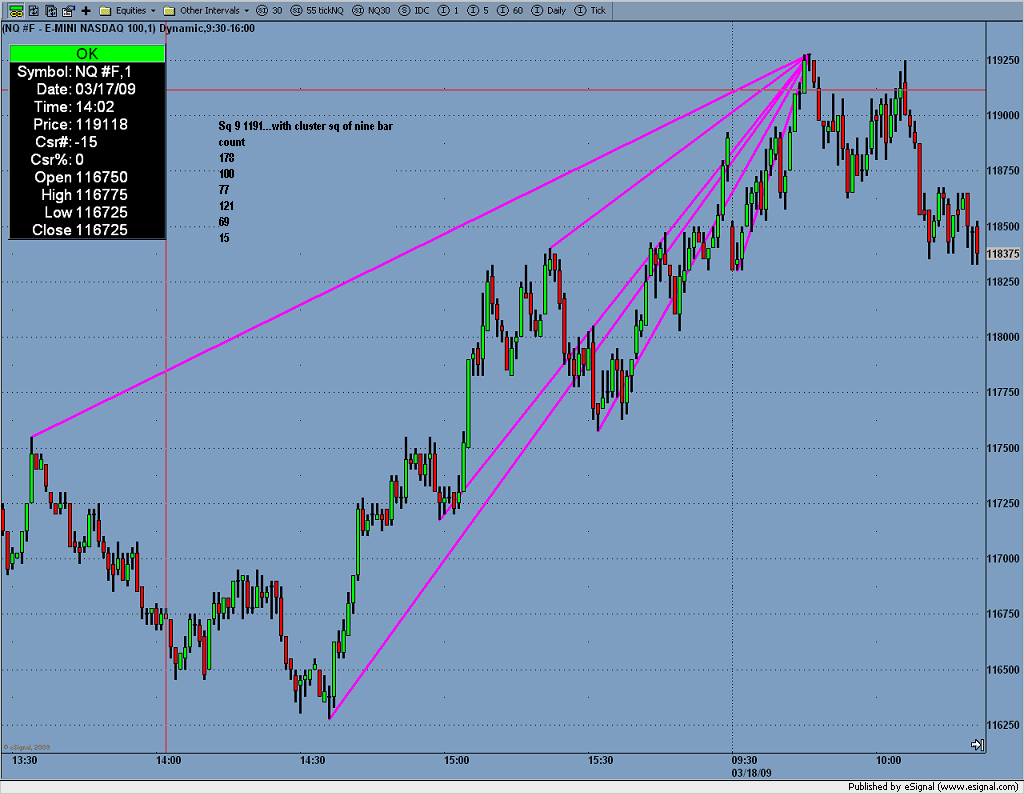
These are not my trading style more for fun to long term for me I can't sleep at night, but my goodness you could make a killing with 1000 bucks worth of options. and 361 days was today so its time to sell for a few days....This is more my time frame 1 min LOL.....
NQ yesterday
Click image for original size
Thanks Joe for all your help!!
Hi CJ,
thanks for your posts which are both very interesting and inspiring !
you are right in saying that it's the trader's job to make a tool work. Threads with complaints such as "fibs don't work, market profile doesn't work" etc. pop up all the time but are pointless as they are beased on wrong expectations.
Regarding the dated SQ9, I'd be happy to receive a scanned copy from you, whenever you have the time... I have experimented with the SQ9 before and also with other things...planetary flux lines and even more funky stuff ( did you know btw. that one can "plot planets" on the SQ9 with the help of an ephemeris ? ).
Regards,
Martin
quote:
Originally posted by CharterJoe
MartinU,
I really don't think I can explain how it works in one post. Basically what it is a large calculator that has dates on the out side and numbers on the inside with 360 degrees you line 0 degrees on the date and it gives you S/R #'s. I have not seen one of these calculators under $500.00. If your interested I could scan a copy to you but I don't know when it will be cause' my 2 year broke my scanner the other day (I think she was dancing on it???), so could be a while till I buy another one since I really don't use on that often.
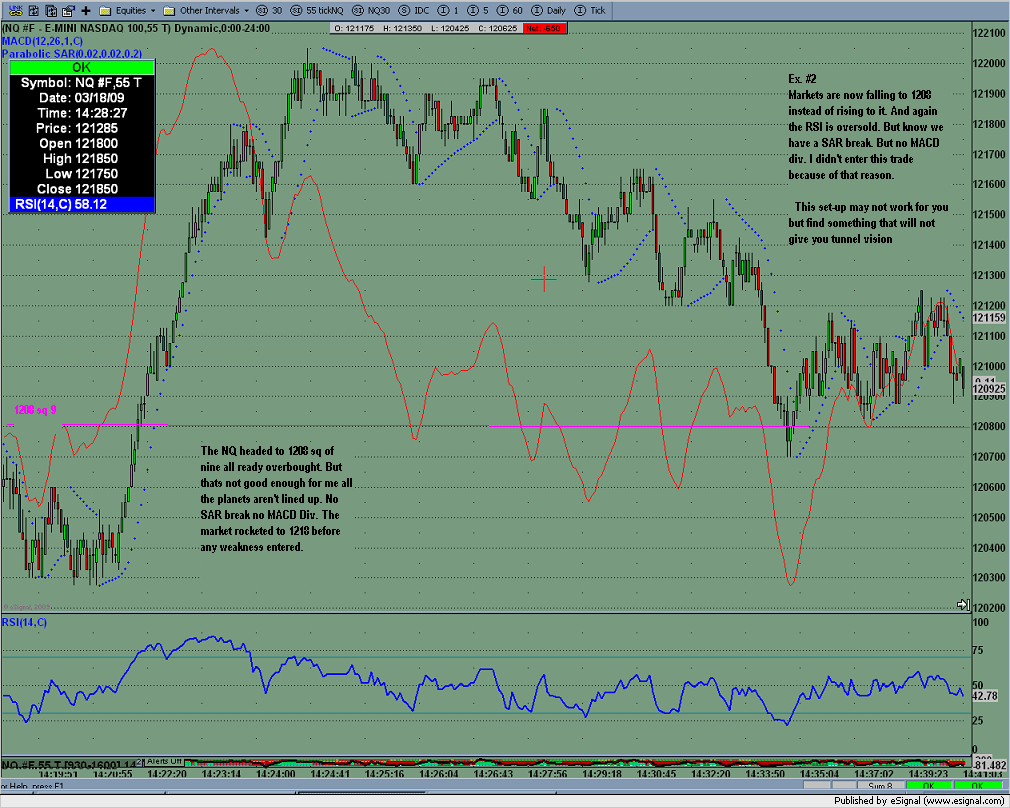
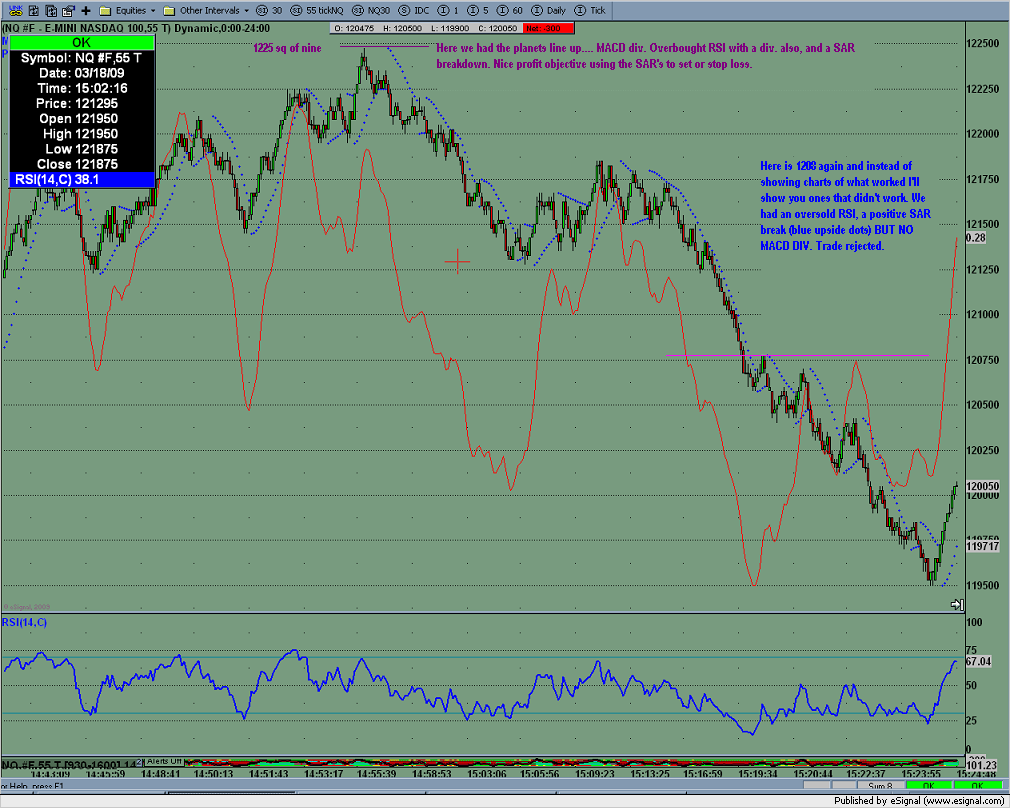
IMHO I think pivots, fibo, and sq of nine all work well (sq of nine the best of course), its the trader. Please don't take this the wrong way I am not saying anything negative to anyone. But if a market is falling like a knife to a sq of nine traderJoe buys and expects a bounce, 2 min passes and nothing happens but the market stalled then fell to his stop loss then falls like a rock to the next sq of nine and traderJoe again buys "expecting" a bounce and again stallandfall. Did the sq of nine's fail? No, the trader failed, he failed to see the "clues". A trader needs other tools, an edge maybe tape reading, maybe traderJoe needs to learn an indicator inside out. I think mine is RSI and MACD divergence's (signal line smoothed to 1) What a trader needs is to know which numbers to trade and which will stall and fail. I get this info from a 55 tick chart on the NQ and a 144 tick on the ES just like I showed in the charts. If the market is falling to a sq of 9 number and there is no MACD divergence, no SAR break then sit back and wait for buyers to come in. I'll post some "failed" sq of nine numbers on the NQ to show you more of what I am looking at.
I haven't traded bonds yet, I started using Sierra charts Aug 1st & it has a sq of 9 study, I remembered this thread & put the sq of 9 study on GC & ZB just to see, the #s are like magnets! The settings that seem to work best are 22.5 degrees & 45 degrees in that order.
Emini Day Trading /
Daily Notes /
Forecast /
Economic Events /
Search /
Terms and Conditions /
Disclaimer /
Books /
Online Books /
Site Map /
Contact /
Privacy Policy /
Links /
About /
Day Trading Forum /
Investment Calculators /
Pivot Point Calculator /
Market Profile Generator /
Fibonacci Calculator /
Mailing List /
Advertise Here /
Articles /
Financial Terms /
Brokers /
Software /
Holidays /
Stock Split Calendar /
Mortgage Calculator /
Donate
Copyright © 2004-2023, MyPivots. All rights reserved.
Copyright © 2004-2023, MyPivots. All rights reserved.