High volume numbers
Here they are from Fridays (11-14-08) trading. Some match up with the Value area numbers. Good targets and fade points.
874 - 876 Minor volume
891 - 893.50
901- 902.50 Minor
910 - 912.50
Bruce
874 - 876 Minor volume
891 - 893.50
901- 902.50 Minor
910 - 912.50
Bruce
here they are from Mondays trade: Same rules will always apply...use them as targets/magnets and zones to fade..
848 - 850
858 - 861
867.50
877.50 - 881
I'll have a few charts posted tomorrow of some cool things that happened in todays trade...
Nice volume came in at the highs and the lows today.....
848 - 850
858 - 861
867.50
877.50 - 881
I'll have a few charts posted tomorrow of some cool things that happened in todays trade...
Nice volume came in at the highs and the lows today.....
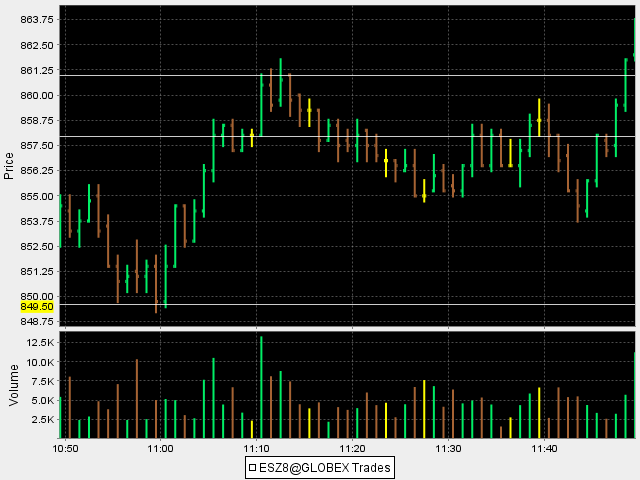
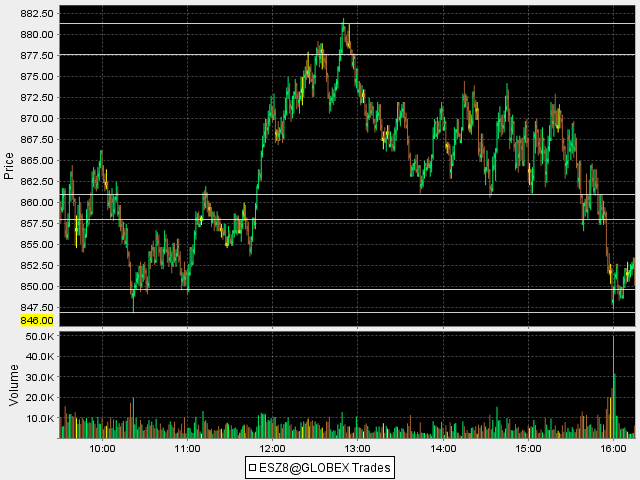
I'll get to these charts as I can..this is mondays trade..Look at this amazing high Volume at the 10:20 lows.....that was down into the minus 8-10 points number off the opening range after breaking the overnight low into a key number of 850......Look at the great retest at 11 a.m.
Click image for original size

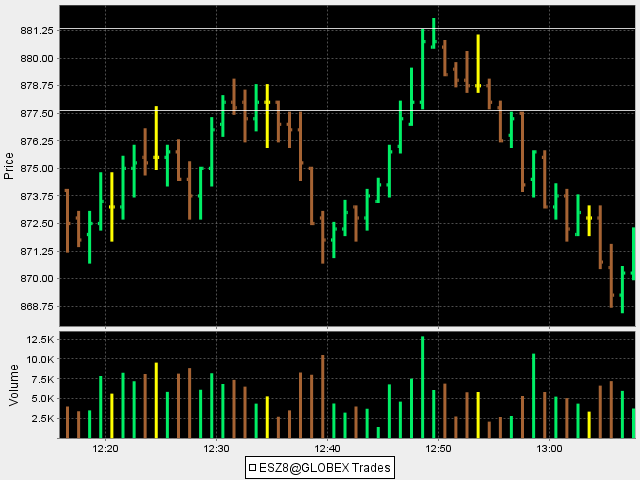
Look at this volume surge into the 858- 861 area...keep this zone in mind.....for a future chart
Click image for original size
On Monday we had a POC and weekly and daily pivot numbers in the 80 - 82 area....look at the volume surge
Click image for original size
This gets really cool now as when we fail at one high volume at that 80 - 82 area price is attracted back to the one below it.....in this case the 59 - 61 zone
Click image for original size
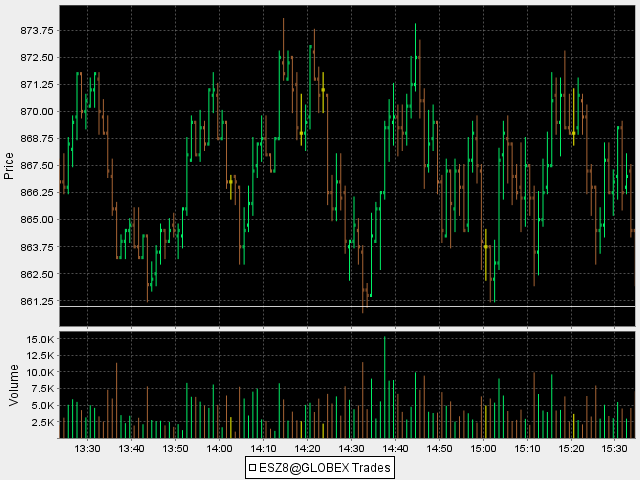
and once we fail at that 59 - 61 zone price trades back to the original high volume area down in the 50 area which started the whole up move
Click image for original size
EXCELLANT WORK, BRUCE!
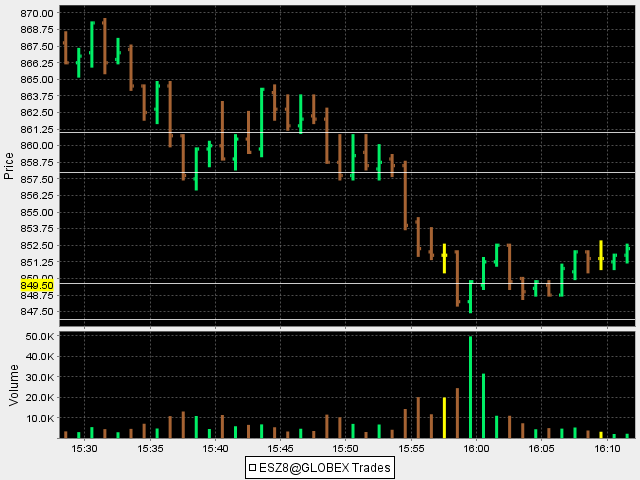
here is the entire day session as it is easier to see on the entire chart
Click image for original size
they played real well today...even got the 67.50....here is the chart with the zones marked off .....looks like they want to run this up for expiration..
Click image for original size

Bruce this very helpful thanks for sharing.
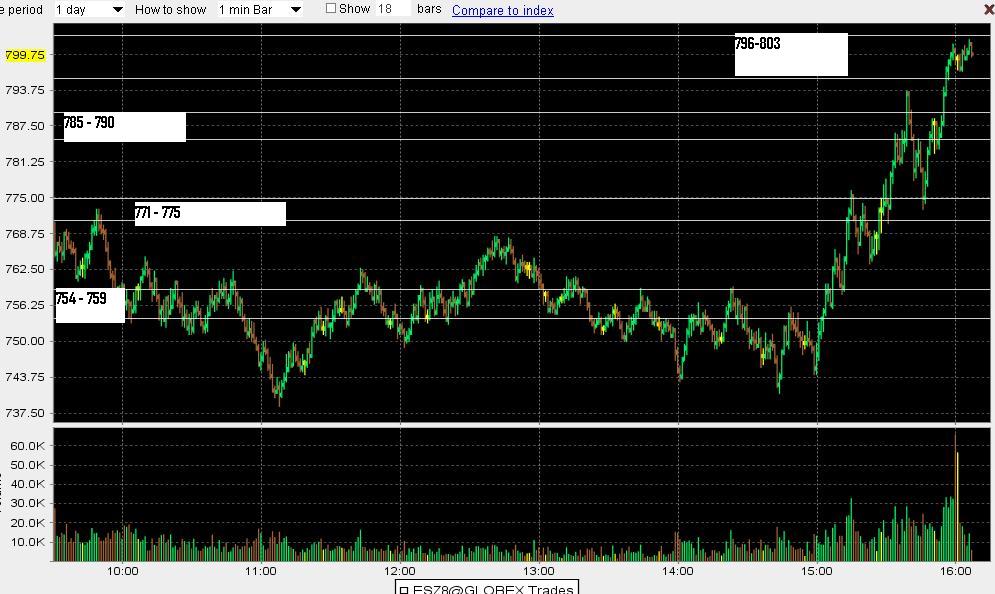
here is a fairly crude S&P chart from a few minutes ago showing the day session only.....I have the high Volume bar zones from yesterday defined on the chart. This is a one minute chart but you can see a few things:
a)How they are attractors of price
b) How they can act like support and/or resistance and reverse polarity
c) How they are not perfect by any means
The hardest part from the volume zones posted today was that we had two big zones fairly close together...the 785 - 790 area and the 796 - 803 we couldn't penetrate the 803 number and we sold off back down to 790 just before the close ( this may not be shown on my chart)
Click image for original size
Emini Day Trading /
Daily Notes /
Forecast /
Economic Events /
Search /
Terms and Conditions /
Disclaimer /
Books /
Online Books /
Site Map /
Contact /
Privacy Policy /
Links /
About /
Day Trading Forum /
Investment Calculators /
Pivot Point Calculator /
Market Profile Generator /
Fibonacci Calculator /
Mailing List /
Advertise Here /
Articles /
Financial Terms /
Brokers /
Software /
Holidays /
Stock Split Calendar /
Mortgage Calculator /
Donate
Copyright © 2004-2023, MyPivots. All rights reserved.
Copyright © 2004-2023, MyPivots. All rights reserved.