Color May Help
FWIW... "Part" of my determining S/R areas involve a color code system recorded on a legal pad.
I have several columns of numbers i.e.--24hr s/r-- Fibs--
RTH s/r-- week s/r-- square of 9-- singles--vah/val--you get the picture.
With all these numbers how do I know an area might be a stronger S/R?
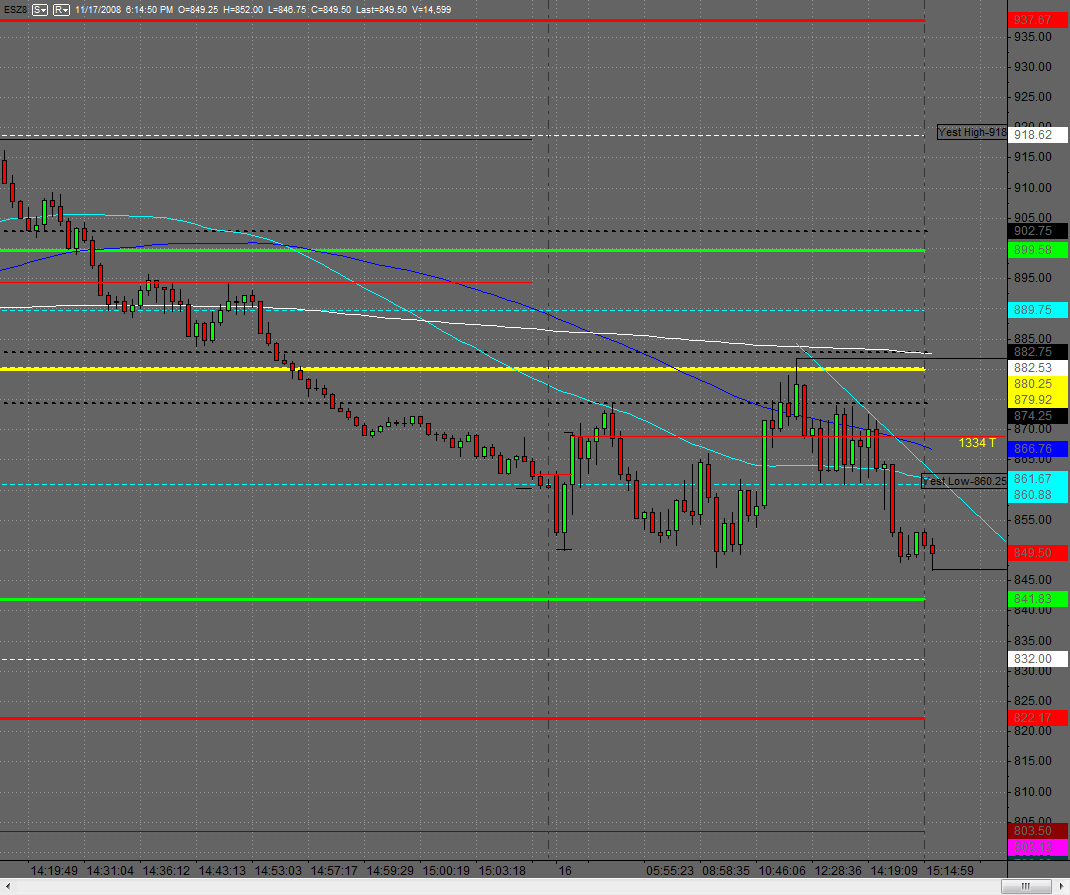
I color code areas that confirm each other. A PP / so9 / fib
would be one color; another area that confirms would be a different color, ect. as always I add volume, and if I get a projection to that area thats topping on the cake or in this case on the S/R.
During the trade day it is easy to see at a glance, as I have the figures before the market opens.............just my 2 cents.
I have several columns of numbers i.e.--24hr s/r-- Fibs--
RTH s/r-- week s/r-- square of 9-- singles--vah/val--you get the picture.
With all these numbers how do I know an area might be a stronger S/R?
I color code areas that confirm each other. A PP / so9 / fib
would be one color; another area that confirms would be a different color, ect. as always I add volume, and if I get a projection to that area thats topping on the cake or in this case on the S/R.
During the trade day it is easy to see at a glance, as I have the figures before the market opens.............just my 2 cents.
Thats interesting thanks for sharing Red. I too use a color coded sysytem that is going on 6 years. This is what I would call my "anchor" chart. I know what each line is based on the color and/or type of line. I dont trade from this chart, but reference it throughout the day.
Click image for original size
Emini Day Trading /
Daily Notes /
Forecast /
Economic Events /
Search /
Terms and Conditions /
Disclaimer /
Books /
Online Books /
Site Map /
Contact /
Privacy Policy /
Links /
About /
Day Trading Forum /
Investment Calculators /
Pivot Point Calculator /
Market Profile Generator /
Fibonacci Calculator /
Mailing List /
Advertise Here /
Articles /
Financial Terms /
Brokers /
Software /
Holidays /
Stock Split Calendar /
Mortgage Calculator /
Donate
Copyright © 2004-2023, MyPivots. All rights reserved.
Copyright © 2004-2023, MyPivots. All rights reserved.