Something for the Volume traders
Here is a a way to watch volume during the day that might help some. This will probably make more sense to those of you that have an understanding of Market Profile.
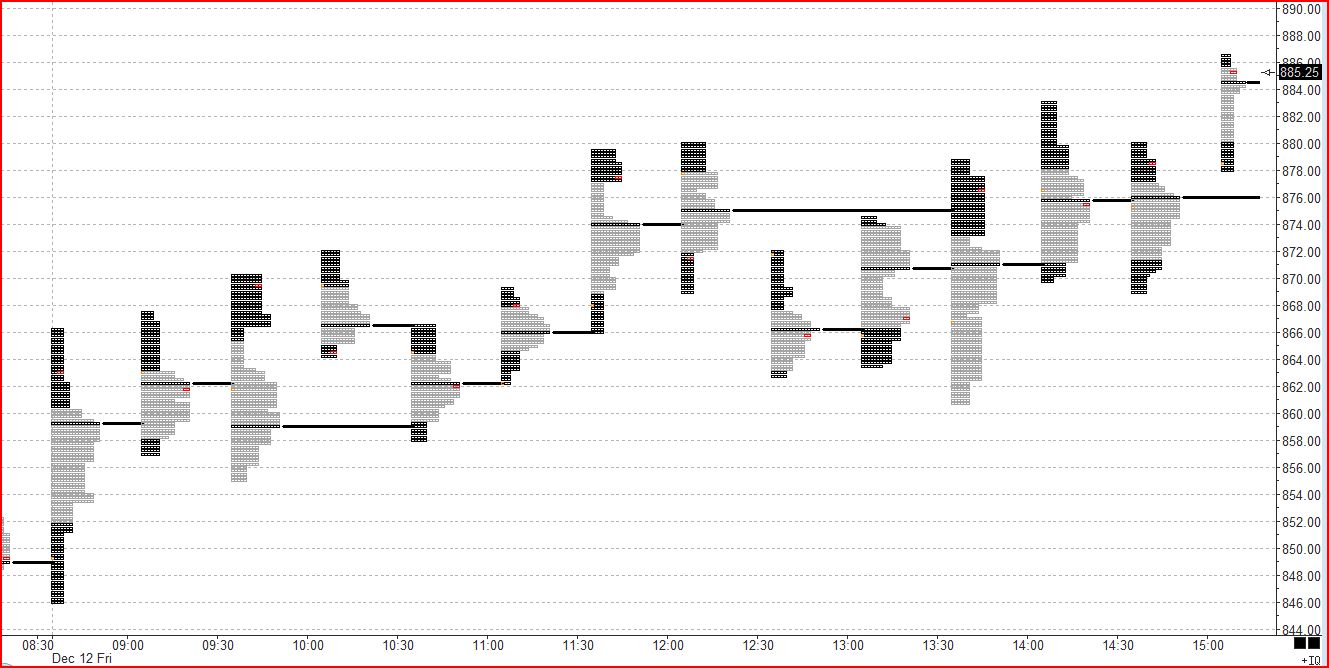
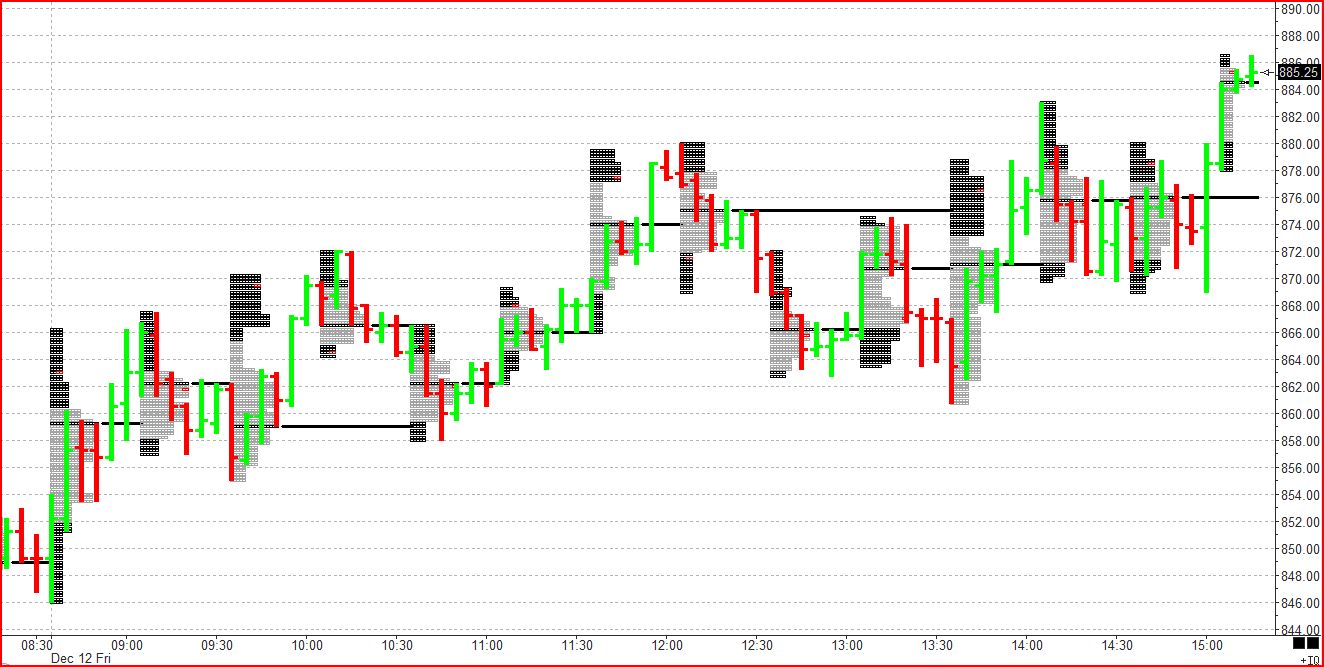
The chart attached shows the volume rotations using 30 minute brackets. You can see that price has a strong tendency to bounce from POC to POC. The second chart uploaded has price bars overlayed and I think you will see how this actually might be helpful.
The chart attached shows the volume rotations using 30 minute brackets. You can see that price has a strong tendency to bounce from POC to POC. The second chart uploaded has price bars overlayed and I think you will see how this actually might be helpful.
Click image for original size
Click image for original size
Excellant chart with very useful info. Great work,Beyond!
What charting software you use? If don't mind me asking.
This was done with Ensign. It is the only charting software, I am aware of, that allows you to view the information in this manner.
I don't mind you asking and I'm willing to discuss this further, as long as it is done in a sincere and respectful manner.
I don't mind you asking and I'm willing to discuss this further, as long as it is done in a sincere and respectful manner.
Top Gun charting software also provides this type of a rotation breakout using volume profiles. They advocate using a 5 minute profile, then look for breakouts from the little value areas.
I can see how breakouts of those areas can be one way trade them, but for me, watching the volume POC's develop realtime provide a better opportunity for me.
Also, using Ensign, I can use volume, tick or time bars, against the volume profiles. I used 5 minute bars against 30 minute brackets in the above example because I thought it would be easier for most to understand. Whatever works best for you is what you should do.
Also, using Ensign, I can use volume, tick or time bars, against the volume profiles. I used 5 minute bars against 30 minute brackets in the above example because I thought it would be easier for most to understand. Whatever works best for you is what you should do.
Emini Day Trading /
Daily Notes /
Forecast /
Economic Events /
Search /
Terms and Conditions /
Disclaimer /
Books /
Online Books /
Site Map /
Contact /
Privacy Policy /
Links /
About /
Day Trading Forum /
Investment Calculators /
Pivot Point Calculator /
Market Profile Generator /
Fibonacci Calculator /
Mailing List /
Advertise Here /
Articles /
Financial Terms /
Brokers /
Software /
Holidays /
Stock Split Calendar /
Mortgage Calculator /
Donate
Copyright © 2004-2023, MyPivots. All rights reserved.
Copyright © 2004-2023, MyPivots. All rights reserved.