Further Discussions
(This is in response to a request by leobust)
I think it is important to understand Market Profile's origins in order to fit it into today's markets.
MP was first developed by Steidlmayer for use in the pits. It was a relatively quick and easy way to organize the auction process by hand. Imagine standing on floor of the exchange and trying to make sense out of the chaos around you. By plotting the rotation of the ongoing auction, Steidlmayer found a way to do that very thing.
At that time, traders were supposed to settle up and turn in their trading cards every 30 minutes. So, it is not surprising, he used 30 minutes as the period of each bracket. And, compared to any other manual charting method used at that time, writing down a single letter during each 1/2 hour period was in fact an excellent form of "shorthand". Also, since real time volume was unavailable, at that time, he only had price to work with.
Consequently, you must give him a tremendous amount of credit to him for coming up with framework that is used today. However, you can also appreciate, we have vastly superior resources available to us, today, to understand and decode the auction process.
Those followers of Market Profile, who have not adapted MP to today's markets and information availability are doing themselves a huge disservice. For example, it is only in the last few years that real time volume is available. Since, MP tries to organize the auction process, what better information could we use than volume, to show us where real activity is taking place. i.e.-In a sideways market, you can see price TPO's build out; but volume TPO's don't.
And, until you can plot the actual movement of price against the rotation, it is very difficult to find what I call a "tradeable event". A "p" or "b" might signify an important situation, but actual price action will always tell you the truth.
Could you please comment if the following is similar to the type setup you're talking about?
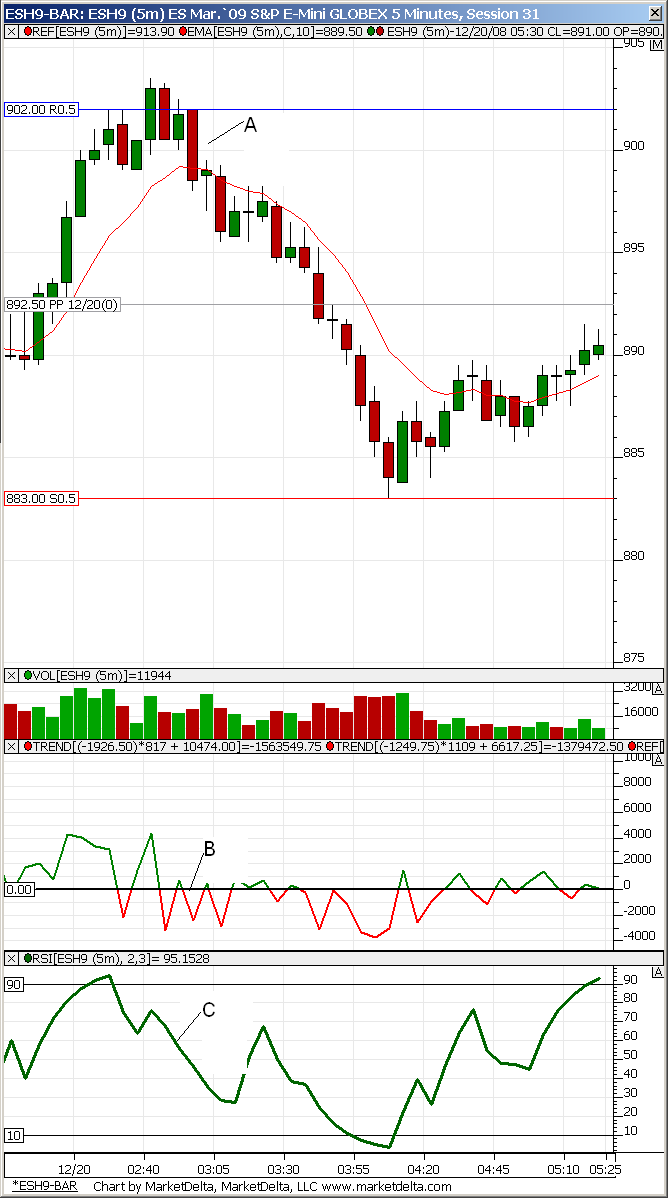
Today at about 10am CST there was a high volume POC at 901 level on the 30min chart. On the 5min bar chart, (see attached), a red candle appeared (A), breaking down previous candle low. The selling pressure (B), confirmed the down move, also the RSI (C) made a lower low.
Also, just before the big red candle, a green candle appeared but did not have a sustained volume to maintain the up move.
Click image for original size
quote:
Originally posted by leobust
Could you please comment if the following is similar to the type setup you're talking about?
Today at about 10am CST there was a high volume POC at 901 level on the 30min chart. On the 5min bar chart, (see attached), a red candle appeared (A), breaking down previous candle low. The selling pressure (B), confirmed the down move, also the RSI (C) made a lower low.
Also, just before the big red candle, a green candle appeared but did not have a sustained volume to maintain the up move.
Excellent, Leo! You identified a great entry. You can see from the chart I posted that the Naked POC from the Globex session acted as the final target for the trade.
A word about the entry- for me the entry was actually 2 bars back from the one you identified. The difference in buying and selling I watch for occurred on that bar. On the entry you cited, for me, it doesn't matter that the bar broke the previous candle's low-as that is only a situation that happened because of the timing of the bar. Where a time bars low is just a matter of chance determined by the time you are watching. If you were using a tick, volume or different time frame that low would mostly likely have occured at a different place.
Also, I caution you regarding the comment on RSI. RSI follows the market, so, it will always confirm a successful trade. But, you will know that quicker from the profit in your account.
Click image for original size

Thanks BeyondMP !
I have a few questions/thoughts that are related to your comments on MP and Volume. Do you treat each NPOC equal or do you filter them to get a better feel for what might be a better point of support or resistance ? You have NPOC's that I see on your chart posted for Leo ( at 84.50, 88.50, 897 and 900.50). Do those become natural targets and awareness zones? From a conceptual standpoint I like your work. I like that you are dialing down and using the volume created for targets and to initiate trades. It's a nice derivation of classic MP concepts.
Briefly onto to volume now:
I was wondering which element of your 4 points below is most important?
The reason I ask is that if we could substitute point # 1 with the following:
"I first identify a point of possible support or resistance..."
then it would seem that point number two is the most important as we need to know when Buying or selling pressure has temporarily "dried up" or one is more dominant at the reference point we determine. It really wouldn't matter what method ( MP, fibs, Pivots etc) we use to find that point.Knowing when the volumes roles reverse or subside would be beneficial to most out there.
We could then use whatever method we like to find S/R below or above the direction of our trade. This would relate your point # 3 below.
It seems that you could trade just from point #2. Perhaps you could expand on that a bit more if you feel it isn't giving away too much.
Thanks for the response.
Bruce
quote:
Originally posted by beyondMP
[
[quote]Originally posted by beyondMP
Volume is one of the factors of trading that most say is important but few have found a consistent and practical way to use.
So, it is important to know what aspect of Volume is referred to whenever the subject comes up. This is, also, important to such terms as Price Action that can mean different things to different traders.
This is the way I use Volume(unexplained version):
1. I first identify a price level that represents a high volume POC of a 30min. bracket
2. I then watch for a significant difference in the buying and selling volume of the period I'm using
3. I then take a trade in the direction of the difference making sure that there isn't another high volume POC to near that might limit my profit potential to an unacceptably low level
4. This is all done in relation to "The Fournier Effect" which helps explains the movement of price (this is an effect on price movement that can be thought of roughly as comparing to the Doppler effect on sound).
I am aware, that my explanation of the way I use Volume might raise more questions than it answers. For example, What is a significant difference?, What period are using?, What limits do you use for profit potential? The Fournier Effect, you got to be kidding??? But, as I consider this more of a general forum to promote thought and discussion I have done this on purpose.
Bruce,
You bring up some very thought provoking issues.
I think every trader needs to develop, for lack of a better term, a "Unified Market Theory". This would be the context through which the trader can filter market action and construct trading rules. For example; let's say I believed Moving Average Crossovers defined the way the market moved. I would then base all my trading strategies on that underlying principle. Through testing and observation I would verify my definition, develop trading rules and sit back and rake in the profits. All one has to do is ask the "Dr. Phil" question-"How's it working for you?" to determine if they're right or wrong in their definition of the market.
My "Unified Market Theory" is based on the way price moves in relation to differences of buying and selling volume. Consequently, it is difficult for me to determine which element is the most important. I can understand how point #2 might be the most important, but, for me, it is only important in a particular context.
I have observed major differences in buying and selling at all sorts of places in the market and often see them lead nowhere. So, just trading from point #2 could lead to major disappointment. The biggest problem was finding a way to quantify those differences in a concrete, verifiable and repeatable manner.
I hope this answered your question, if not let me know.
As to the first part of your questions, I observe the NPOC in relation to where price is currently. If going long, I look to see how and what kind of grouping is above, giving more importance to an area where there are 2 more NPOC's lurking;i.e.-bunched together.
Emini Day Trading /
Daily Notes /
Forecast /
Economic Events /
Search /
Terms and Conditions /
Disclaimer /
Books /
Online Books /
Site Map /
Contact /
Privacy Policy /
Links /
About /
Day Trading Forum /
Investment Calculators /
Pivot Point Calculator /
Market Profile Generator /
Fibonacci Calculator /
Mailing List /
Advertise Here /
Articles /
Financial Terms /
Brokers /
Software /
Holidays /
Stock Split Calendar /
Mortgage Calculator /
Donate
Copyright © 2004-2023, MyPivots. All rights reserved.
Copyright © 2004-2023, MyPivots. All rights reserved.