ES 12-26-08
Good morning all! just sold 2@ the 15 min deadly projection of 868.50; Lets keep in mind however that there is an outstanding hourly projection of 871.25 yet to be fullfilled.
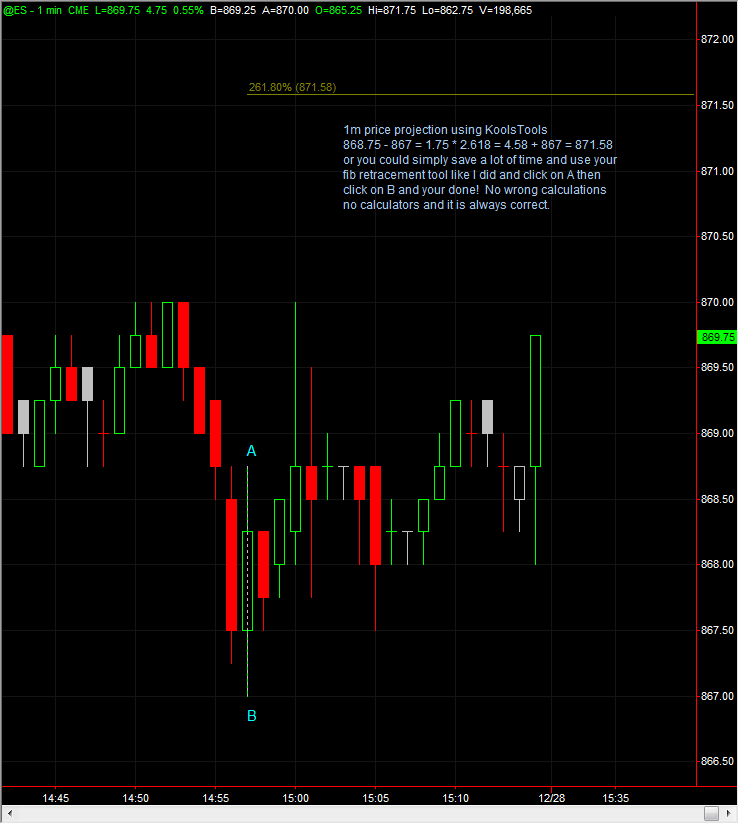
sjzeno, here is the current 1m projection...in this case you would use the low candle only...not sure what you mean by lod - I show that at 62.75
Click image for original size

sjzeno, after you clean up your first chart a bit you should consider posting it in the charts thread
when do projections become invalid?
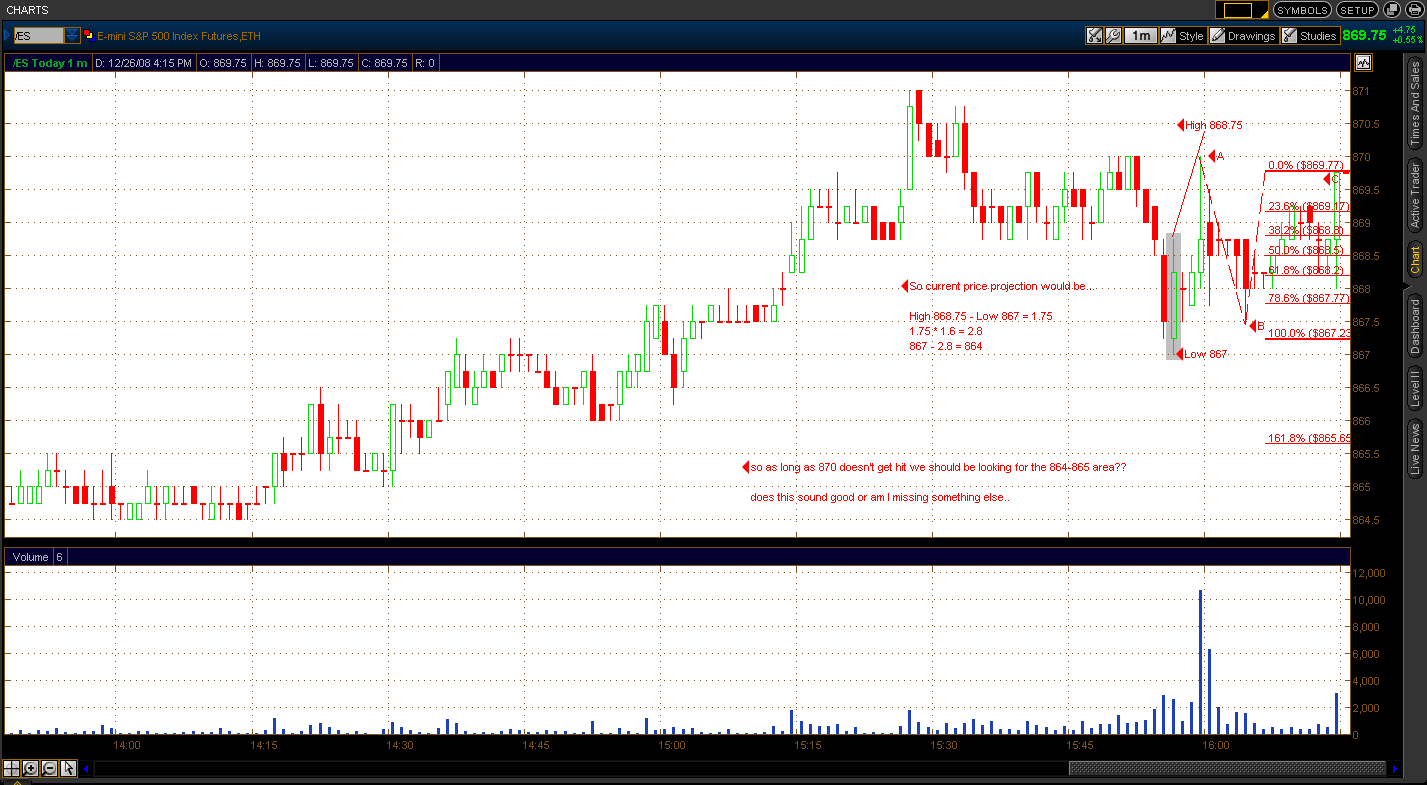
Ok here is what I am looking at now since you pointed out how to get the price projection and maybe an a-b-c...and i'll post that other chart in the chart section a little later i have to run now...
Click image for original size
Click image for original size
sj: on this last chart you posted, the ABC you have marked does not look valid to me.
your measuring from the low at 867.00 (starting point) to the high at 868.75, which is an upthrust meaning your projection off that low would be to the upside.
so in your calculation you would be adding 2.8 to 868.75 rather than subtracting it from 867.
OR you can use the handy <b> MYPIVOTS.COM Fibonacci Calculator</b> !
http://www.mypivots.com/investment-calculators/fibonacci-calculator
VO , on your chart I would mark 867.00 as point A (starting point) and 868.75 as point B.
yes PT, I suppose your right - dont want to add to the confusion...I should have marked them 1 & 2...I just wanted to make sure that the high (A) was the first click in the sequence...
quote:
Originally posted by VOwater
yes PT, I suppose your right - dont want to add to the confusion...I should have marked them 1 & 2...I just wanted to make sure that the high (A) was the first click in the sequence...
OK, thanks for the clarification (i thought it was a typo).
I always start point A (first click) at the starting point, in this case 876.00, perhaps this is a difference in how the fibonacci tool works in NinjaTrader as compared to Tradestation.
PT, I was trying to show sj how to come up with koolstools projection. Actually what that shows (and kools "projections") is the "Extension" of that specific leg (A to B in this case). So, when we talk about finding "projections" using Kool's method we are really using incorrect terminolgy. There are 4 types of fibonacci: retracements, extensions, projections, and expansions. I was thinking about doing a fibo thread because I know there is a lot of confusion out there. That is going to be on my to-do list. Hope this doesn't come across as I'm some fibo expert, guru, maharishni because I'm not!
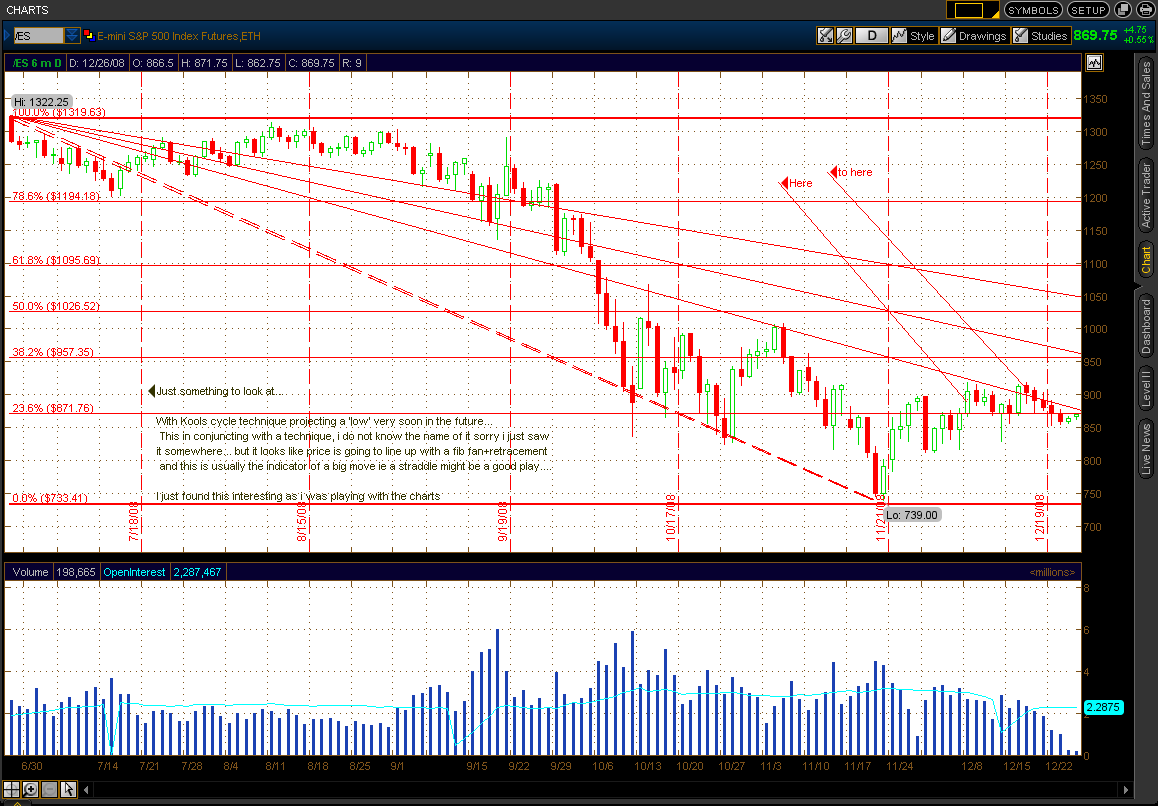
Here is something to look at...
Using Kool's cycle method plus a fib fan+retracement
we get a possible price lineup coming next week. This indicates that there could be a possible big move ie straddle might be a good idea to look into... But Kools cycle is showing a mini'low' so maybe this move would be biased to the upside and there is also an abc pattern before this still not negated...
This is something I just came across, throw some ideas out there what you think about it?
Click image for original size
Emini Day Trading /
Daily Notes /
Forecast /
Economic Events /
Search /
Terms and Conditions /
Disclaimer /
Books /
Online Books /
Site Map /
Contact /
Privacy Policy /
Links /
About /
Day Trading Forum /
Investment Calculators /
Pivot Point Calculator /
Market Profile Generator /
Fibonacci Calculator /
Mailing List /
Advertise Here /
Articles /
Financial Terms /
Brokers /
Software /
Holidays /
Stock Split Calendar /
Mortgage Calculator /
Donate
Copyright © 2004-2023, MyPivots. All rights reserved.
Copyright © 2004-2023, MyPivots. All rights reserved.