Merged Profile
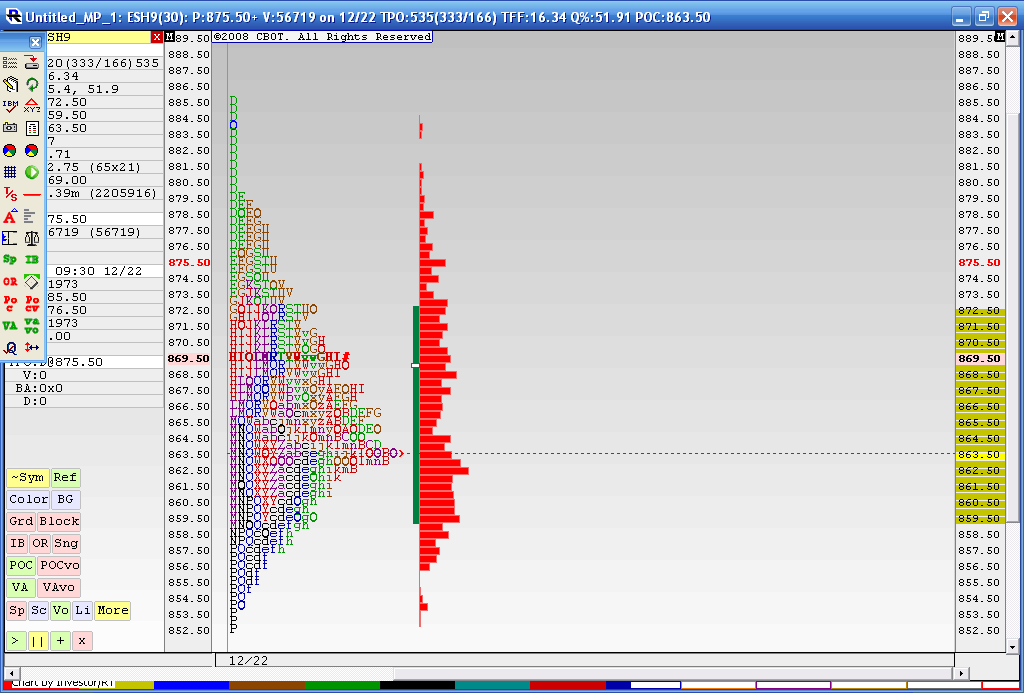
Below is the result from a 4 day merged profile as this is where we most recently have consolidated during holiday trade. The Value area high of this merge is 872.50 and the Value area low is 59.50. You may also notice that the 863.50 price has had the most trade through so far. This chart doesn't include today's trading. I think that 59.50 - 63.50 is the area we need to beat for any upside to take hold as we have the Va low and that Volume node. Current overnight high is 73.50 so it was fairly close to the merged VA high of 72.50.
In today's trading we have single prints created to the downside and through that high volume node. I'm skeptical because of the holidays and low volume but as most know we will trend many times after consolidations. I'm not sure if this counts. Anyway it's been fun firing up the old MP software for a change.
To make a long story longer: That 859.50 - 863.50 is the critical zone to watch.
Click image for original size
good call on the top,u need to respect the deep cleavage at 850-53 as first target
Thanks DW.........the numbers in between , are you just merely breaking up the range into eighths from the 10 day ? Is there a science to that? Why not break up the 20 day limit points?
Kool can correct me if I'm wrong but anytime we get closing TICKS above 800 we get a significant decline in the next few days.....we have had plus 1000 or more on Thursday and Friday with Friday also having a 39 for a closing TRIN..
MP since 1986 IOWA ? any secrets you care to share with us?
Thanks
Kool can correct me if I'm wrong but anytime we get closing TICKS above 800 we get a significant decline in the next few days.....we have had plus 1000 or more on Thursday and Friday with Friday also having a 39 for a closing TRIN..
MP since 1986 IOWA ? any secrets you care to share with us?
Thanks
here is the "p" profile from mondays and fridays trade....lower prices coming?
Click image for original size
D.W.
Great chart
Great chart
the best single prints will have high vertical volume ( not time at price = tpo volume)so while these will be called low volume areas because TIME hasn't been spent trading there the BEST areas are made from HIGH volume....that 47 - 52 zone is a great example........we tried to go there in Sundays overnight and now so far mondays overnight low is 51.75....no coincidence.....
The VA Overlay Chart I posted yesterday is my modofication of charts available at Cisco Futures (http://www.cisco-futures.com) in their "Cmaps" function. The red numbers shown refer to the VAH & VAL of the various distribution curves recognizable in the most recent 5, 10 & 20 day trading periods. The POC is readily recognizable but not specifically defined.
Bruce's reference to eigths I think is a reference to one of Don Jones' (Cisco futures) suggestions for day trading rotational markets using the previous day's VA.. He suggested entry an eigth below the VAH to go short or an eigth above the VAL to go long. My posted chart makes no reference to eigths. Applying the "eigths" methodology to longer term treading is, as far as I know, undocumented.
Bruce's reference to eigths I think is a reference to one of Don Jones' (Cisco futures) suggestions for day trading rotational markets using the previous day's VA.. He suggested entry an eigth below the VAH to go short or an eigth above the VAL to go long. My posted chart makes no reference to eigths. Applying the "eigths" methodology to longer term treading is, as far as I know, undocumented.
An eigth of what you may ask. An eigth of the VA - if the VAH is 860.00 and the VAL is 852.00 then the VA area is 8.00 points; and eigth would be 1.00 point. So in a roational market Jones suggests short at 859.00 or long at 853.00.
Thank you Bruce and D.W.
Looks like Murrey Math applied to MP.
Looks like Murrey Math applied to MP.
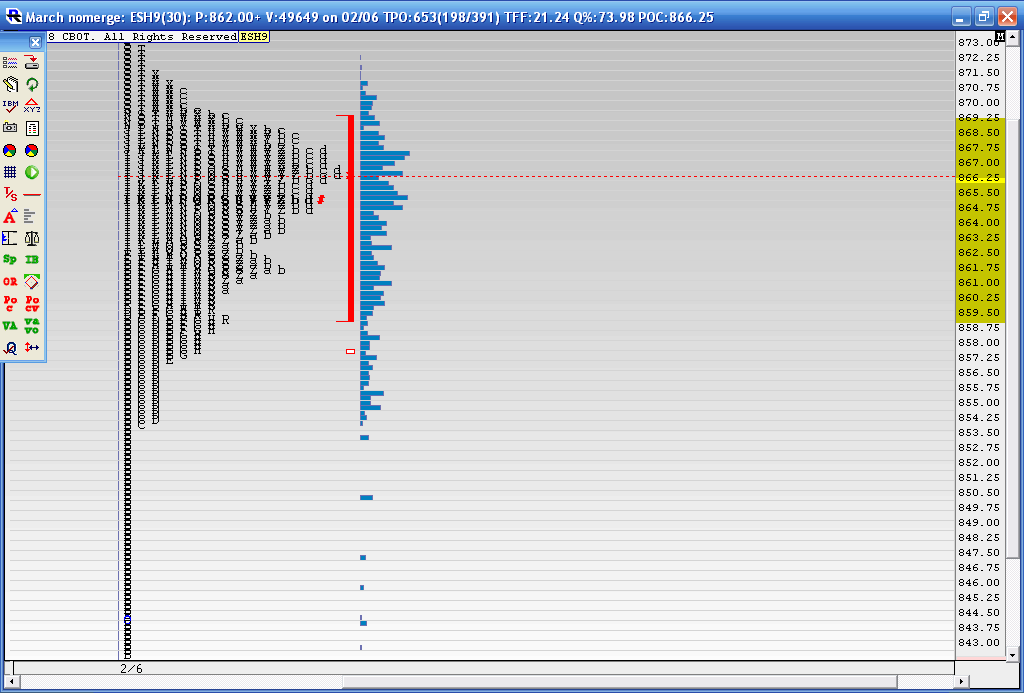
here is a chart that shows Fridays break out to the upside of the congestion period ( composite on the left) and Monday and Tuesdays trade. This break out happened in the "B" period on 2-06 and left a buying tail. You may recall that I mentioned high vertical volume ( you folks know how I like to watch the volume surges on the one minute chart) that happened in the 847 - 852 area. I snapped two horizontal red line on the chart to denote this area.
Now it gets real cool because we formed the "P" pattern with Mondays trade into the key 866 area of our long term composite. On Tuesday we get the sell off that originates from the 866 area. Look how we form single prints during the "E" period yesterday (2-10). These happened in the same area as the ones that formed originally on the up move from friday. Yesterday's high volume (based on the volume surge not shown)area is again in the 47 - 52 area........It seems that those folks who bought the breakout on Friday , reversed positions in the same zone......
now to the downside. You can also see how we traded back into the Value area of the composite and down into the high Volume node of the composite in the 25 area.
So now the critcial area will be up at that 47 area. We still have a minor number at 40 but gut feel is that they want to try to bring in the breakdown traders at the 814 - 816 area and try to challenge the 808 lows of the composite. I'm just not sure when. Hope this makes sense
Click image for original size

DW, I haven't been able to create the same Value area on the 5, 10 and 20 day composites that you show. I'm not sure they are actually value areas and here is why I think that.
I'm busy slowly making my way through Jones' Market Based Value trading free pdf book. He defines bracket extremes by using 3 tpo limits if the period of time is 5 or 10 days in length. Otherwise he will use 5 TPO's if the period is 20 days. So it seems to me he then breaks up the bracket into octants and uses the following rules IF we are in a bracket...that's key.
1) a RESPONSIVE long is placed when we fall between the lower octant and the lower bracket extreme and trade back up
2) a responsive short is placed if we trade above the upper octant and the upper bracket extreme and trade back through the octant on the downside
TARGET for this trade is the center of the bracket
3) Breakout trades are taken if we trade through either bracket extreme and then the octant point becomes the stop loss and the trade is closed out on the close.
This is just my take and haven't made it through the whole manual yet.
With the current bracket they ( in theroy) will try to sell the 812 area (bracket downside limit) if we get down there and risk about 4.25 points ( one octant using 812 and 849 as the bracket limits)but they will also look for responsive longs between the downside bracket limit and the first octant up....so somewhere between 812 and 816.25..........(looking for buying tails etc)......trades will also use the previous days value area and current days action to help filter trades.
I'm basing the above numbers using the compsoite chart summary I just posted ( because I'm on another computer) . This chart has been scaled to fit the screen better so my TPO count at the bracket limits may not be accurate.....
Gheesh that's heavy stuff!!!
It will be interesting to watch over time if/when these types of trades happen
quote:
Originally posted by dafydd
The VA Overlay Chart I posted yesterday is my modofication of charts available at Cisco Futures (http://www.cisco-futures.com) in their "Cmaps" function. The red numbers shown refer to the VAH & VAL of the various distribution curves recognizable in the most recent 5, 10 & 20 day trading periods. The POC is readily recognizable but not specifically defined.
Bruce's reference to eigths I think is a reference to one of Don Jones' (Cisco futures) suggestions for day trading rotational markets using the previous day's VA.. He suggested entry an eigth below the VAH to go short or an eigth above the VAL to go long. My posted chart makes no reference to eigths. Applying the "eigths" methodology to longer term treading is, as far as I know, undocumented.
We had a break out up on yesterdays high Volume fed announcement.....now we need to see if we can attract Volume above...my feeling is that they will fail on this breakout and we will get daily closes back below 867.....Sure hope I'm wrong for the longer term players like myself....I'll get a chart later
Emini Day Trading /
Daily Notes /
Forecast /
Economic Events /
Search /
Terms and Conditions /
Disclaimer /
Books /
Online Books /
Site Map /
Contact /
Privacy Policy /
Links /
About /
Day Trading Forum /
Investment Calculators /
Pivot Point Calculator /
Market Profile Generator /
Fibonacci Calculator /
Mailing List /
Advertise Here /
Articles /
Financial Terms /
Brokers /
Software /
Holidays /
Stock Split Calendar /
Mortgage Calculator /
Donate
Copyright © 2004-2023, MyPivots. All rights reserved.
Copyright © 2004-2023, MyPivots. All rights reserved.