Merged Profile
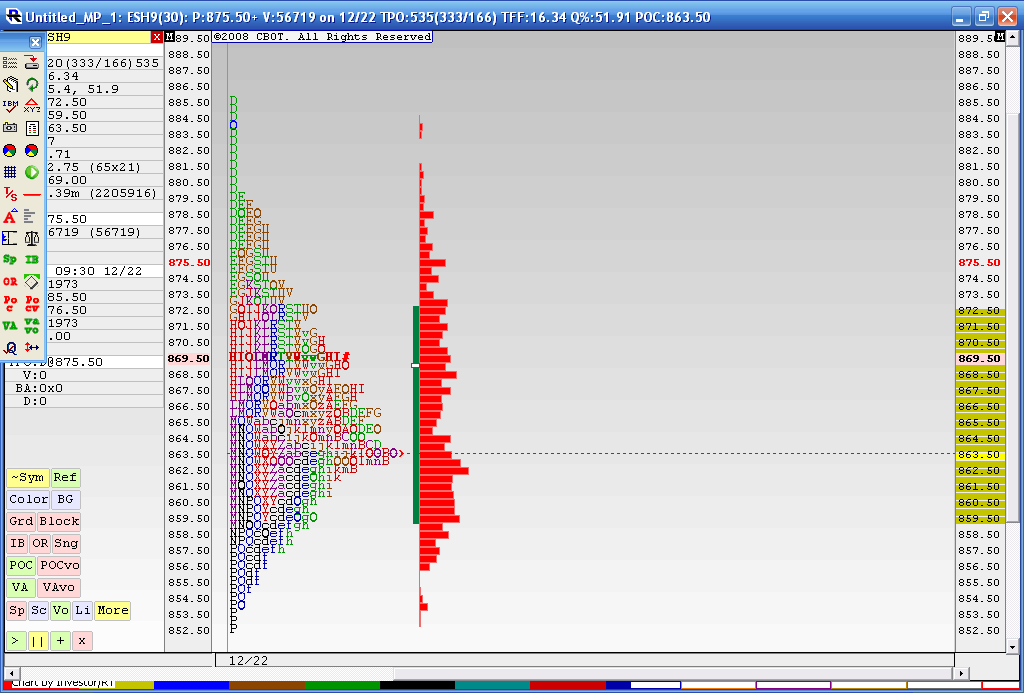
Below is the result from a 4 day merged profile as this is where we most recently have consolidated during holiday trade. The Value area high of this merge is 872.50 and the Value area low is 59.50. You may also notice that the 863.50 price has had the most trade through so far. This chart doesn't include today's trading. I think that 59.50 - 63.50 is the area we need to beat for any upside to take hold as we have the Va low and that Volume node. Current overnight high is 73.50 so it was fairly close to the merged VA high of 72.50.
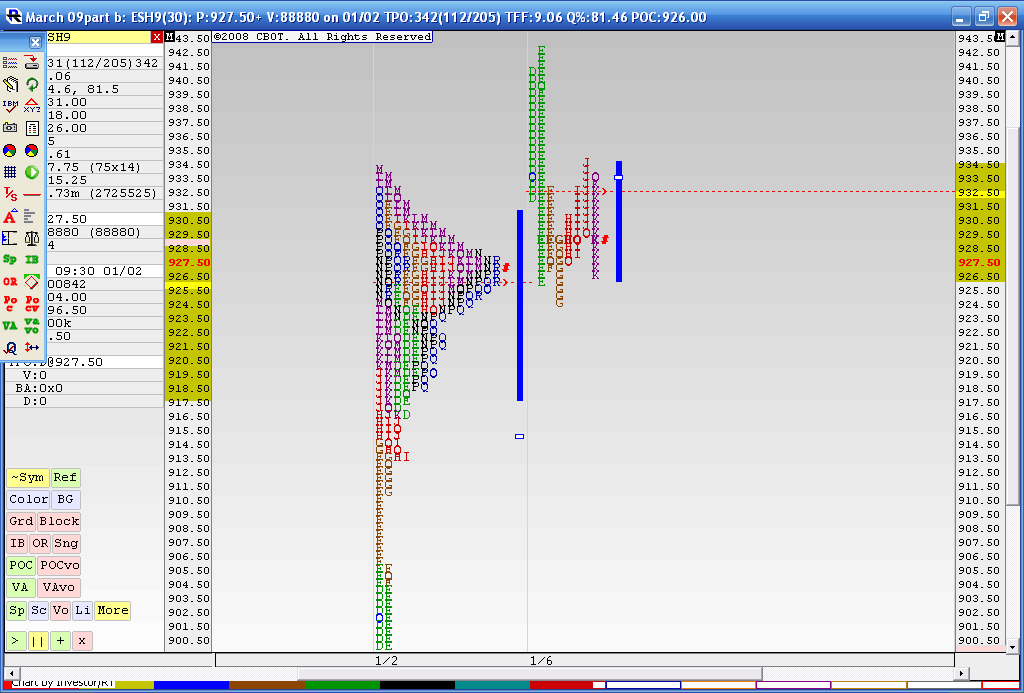
In today's trading we have single prints created to the downside and through that high volume node. I'm skeptical because of the holidays and low volume but as most know we will trend many times after consolidations. I'm not sure if this counts. Anyway it's been fun firing up the old MP software for a change.
To make a long story longer: That 859.50 - 863.50 is the critical zone to watch.
Click image for original size
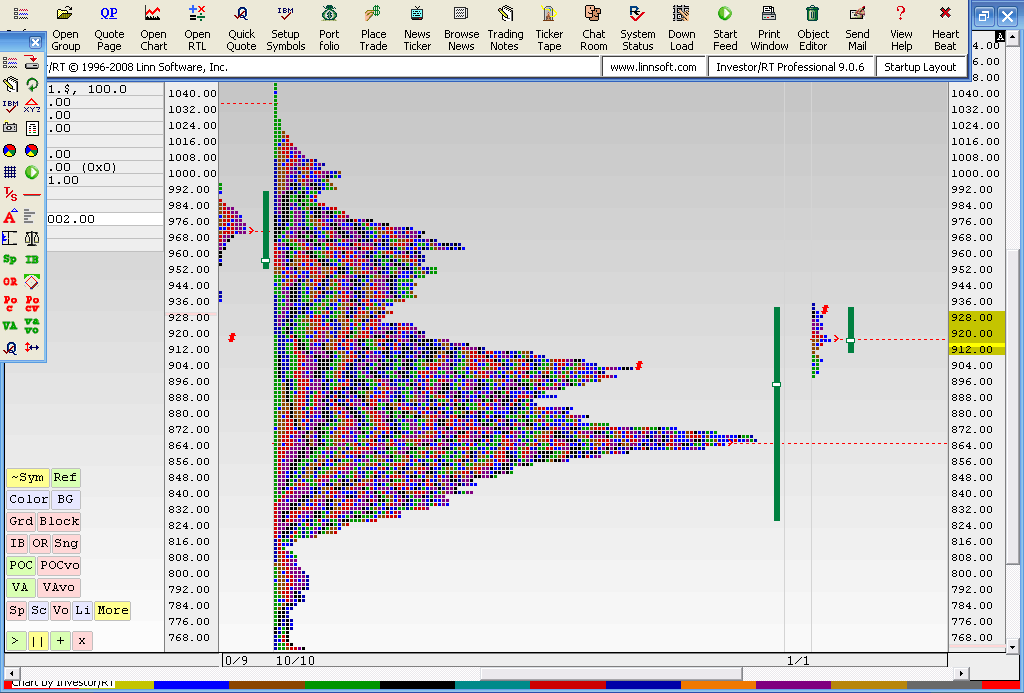
A possible idea to use as I go forward with this is to trade in the direction of the highest volume node for the time frame you choose. So we want the high volume below us to support longs or above us to support shorts, provided that we are trading near the high volume area. In this case I was looking at the 899 - 904 area. So in theory once we were above that then longs would be prefered. Just something to think about as I go forward.
Here is a longer term chart of the SPX cash. I started the merged profile as of the October 10th low as we have had minimal probes below that low...and have consolidated quite a bit from there. The market is trying to get out of the Value area high of this consolidation and probed the upper part of the longer term VA high on Friday. Lets see what happens from here....
Click image for original size
Nice work Bruce.
Looking at your last chart, a couple quick observations:
1. Market should stall on the first touch of that low volume V area around the 930-34 area
2. If 940 is accepted, then the projection is up to the peaks of 950 and 970, with the next V area around the 990 area.
3. Rejection of 936 would project back to first peak at the 910'ish area.
Very well said PT. The challenge for me is determining what is " accepted " on a longer time frame. Would the big players use daily closes for signals? Can we use a modified (80% rule concept ) with daily bars/closes? It seems that many vendors can analyse the longer term stuff but they are not much help on trade signals. I hope to fiqure some of it out.......I still think this test up is the fake out. A break from value and a close back inside will be interesting if the do that today with a daily close
I guess the ideal thing I'm trying to verify is if we need to let the lower time frame profiles finish out their profiles before a longer time frame needs to complete. This is no different then some of the challenges we face with multiple time fram analysis. Suppose we have a "P" shape, step 3 on a small time frame but we haven't completed step 4 on a longer time frame
Bruce,
Have you read this newsletter on Market Profile and Big Picture overview by Joseph James?
http://www.josephjames.com/index.html (free 2 week trial)
http://www.josephjames.com/services.php
Have you read this newsletter on Market Profile and Big Picture overview by Joseph James?
http://www.josephjames.com/index.html (free 2 week trial)
http://www.josephjames.com/services.php
No but I'll take the free trial ..thanks
It seems everything I read is bullish these days so perhaps I'll be wrong on this move. Steidlmayer talks about the 4 stages of Market developement.
Step one is Strong vertical movement - Is this the rally that began on 12-29 ?
Step two is a stopping price - This is where the directional moved stopped - Could this describe Mondays trade?
Step three is when the profile froms a "b" or a "P" shape....- is this what happened the past two days?
Step 4 is when the market tries to fill in some or all of the vertical move......so when should this happen..Tomorrow, Wednesday ..NEVER? In this stage the profile becomes bell shaped. It's obvious that different time frames are in different stages of developement and that is the challenge.
Tricky stuff...
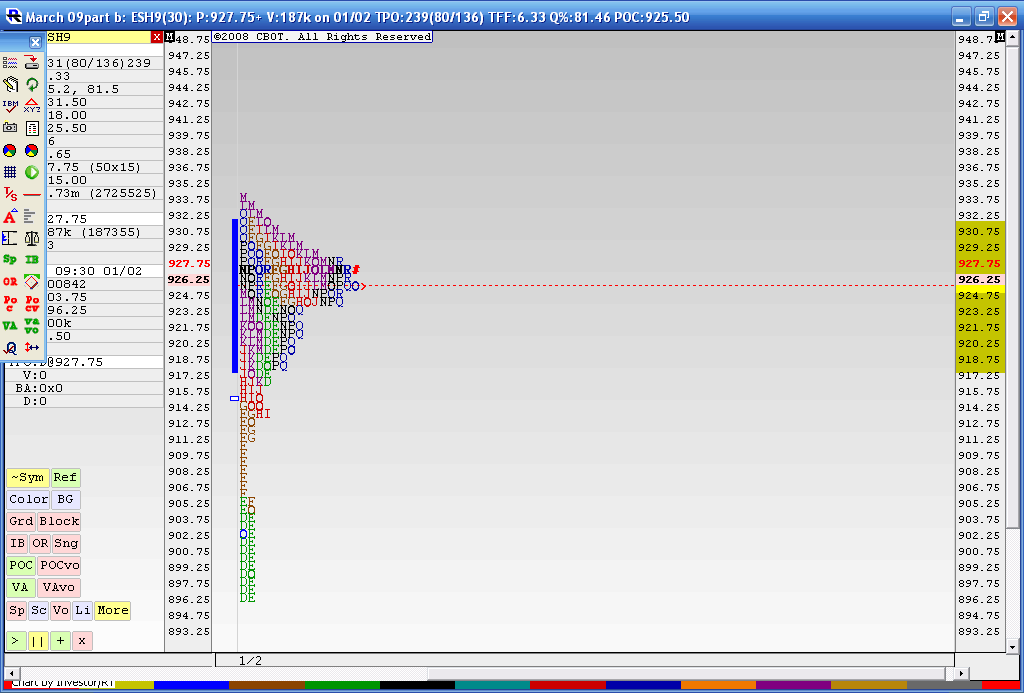
Here is what the profile looks like when we combine Fridays and Mondays trading
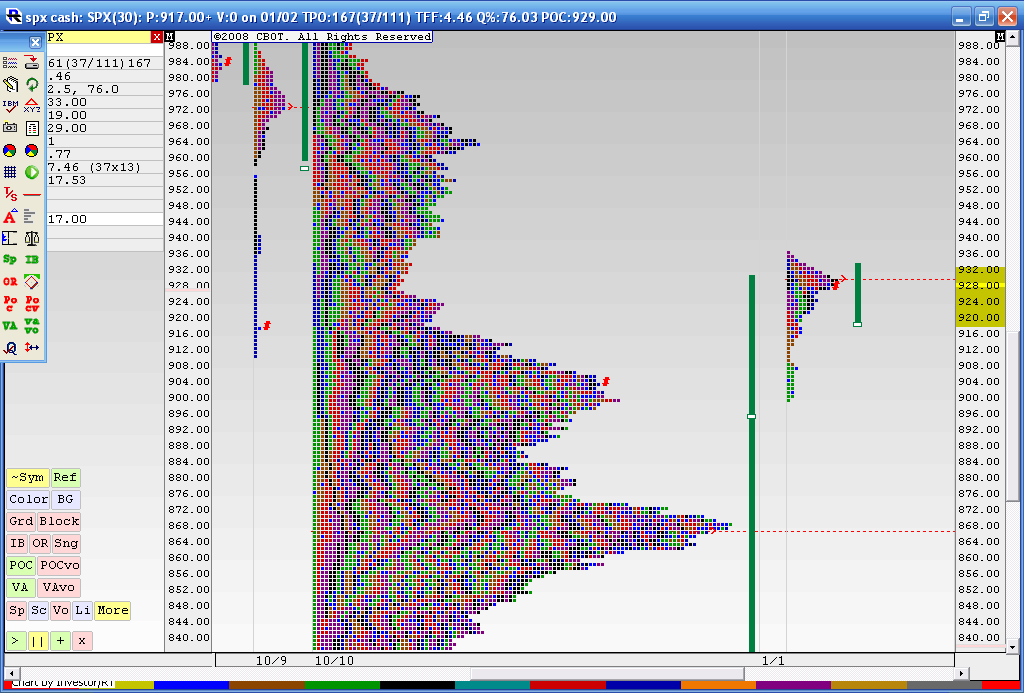
here is how the cash is shaping up against it's longer term profile. It seems to me that IF the bulls win then the 960-964 basis cash is the zone to watch providing they can clare 940. I don't think they can do it!
Step one is Strong vertical movement - Is this the rally that began on 12-29 ?
Step two is a stopping price - This is where the directional moved stopped - Could this describe Mondays trade?
Step three is when the profile froms a "b" or a "P" shape....- is this what happened the past two days?
Step 4 is when the market tries to fill in some or all of the vertical move......so when should this happen..Tomorrow, Wednesday ..NEVER? In this stage the profile becomes bell shaped. It's obvious that different time frames are in different stages of developement and that is the challenge.
Tricky stuff...
Here is what the profile looks like when we combine Fridays and Mondays trading
Click image for original size
here is how the cash is shaping up against it's longer term profile. It seems to me that IF the bulls win then the 960-964 basis cash is the zone to watch providing they can clare 940. I don't think they can do it!
Click image for original size
all these patterns are time frame dependant. We may have a "p" formation on one time frame that is
part of a bigger Bell shape curve or even a "b" pattern on a longer time frame.
I've also noticed that many times they will try and fake us out by breaking out of the formation on one side but then bring it back out of the other side. The second breakout is usually the better one.
In the above case if we see a higher open above the buldge in the "p" formation and then we get under the buldge then we should accelerate to the downside below it. The reverse isn't always true though...if we open lower than the buldge in the "p" formation and then get above it the market won't specifically rally. Just a general observation.
Here is what is currently happening at 1:25 Eastern...( letter K).WE opened higher and the battle is being fought at the buldge in the composite profile for the past two days....if we roll over here to the down side then it could get ugly for the longer term point of view...We know we have single prints and the weekly pivot down at 910 and 903 area...
Click image for original size
We had a break out up on yesterdays high Volume fed announcement.....now we need to see if we can attract Volume above...my feeling is that they will fail on this breakout and we will get daily closes back below 867.....Sure hope I'm wrong for the longer term players like myself....I'll get a chart later
Emini Day Trading /
Daily Notes /
Forecast /
Economic Events /
Search /
Terms and Conditions /
Disclaimer /
Books /
Online Books /
Site Map /
Contact /
Privacy Policy /
Links /
About /
Day Trading Forum /
Investment Calculators /
Pivot Point Calculator /
Market Profile Generator /
Fibonacci Calculator /
Mailing List /
Advertise Here /
Articles /
Financial Terms /
Brokers /
Software /
Holidays /
Stock Split Calendar /
Mortgage Calculator /
Donate
Copyright © 2004-2023, MyPivots. All rights reserved.
Copyright © 2004-2023, MyPivots. All rights reserved.