Merged Profile
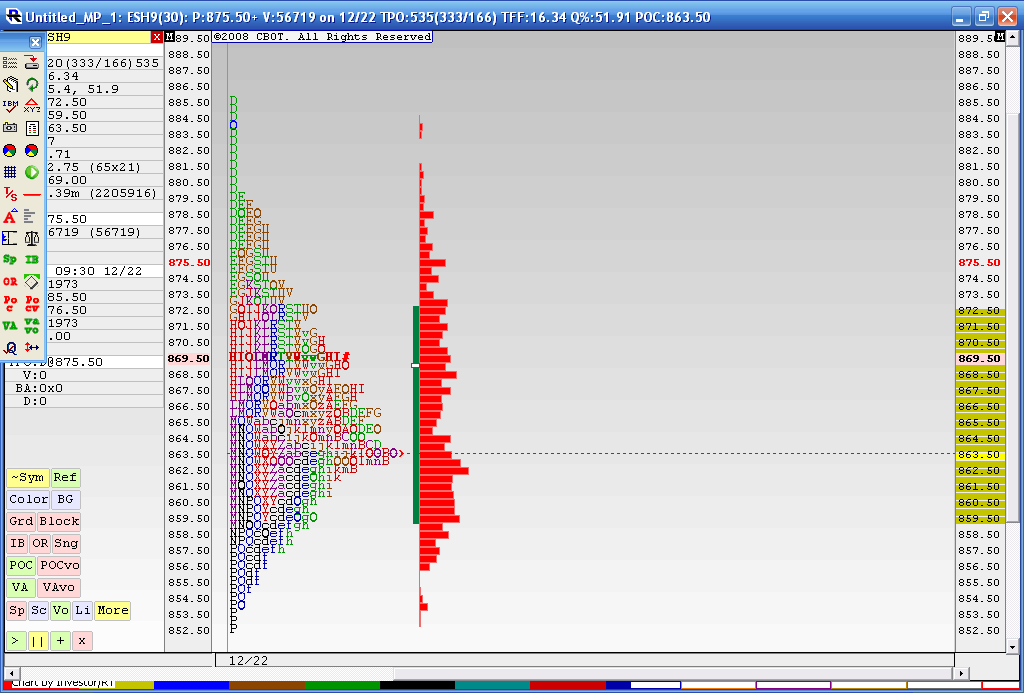
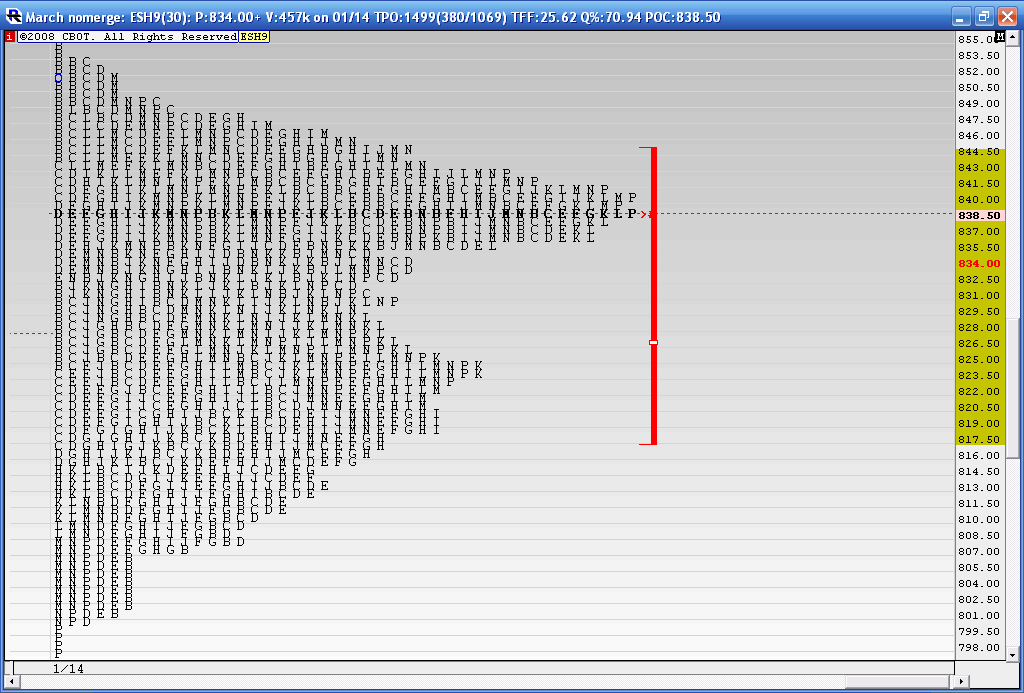
Below is the result from a 4 day merged profile as this is where we most recently have consolidated during holiday trade. The Value area high of this merge is 872.50 and the Value area low is 59.50. You may also notice that the 863.50 price has had the most trade through so far. This chart doesn't include today's trading. I think that 59.50 - 63.50 is the area we need to beat for any upside to take hold as we have the Va low and that Volume node. Current overnight high is 73.50 so it was fairly close to the merged VA high of 72.50.
In today's trading we have single prints created to the downside and through that high volume node. I'm skeptical because of the holidays and low volume but as most know we will trend many times after consolidations. I'm not sure if this counts. Anyway it's been fun firing up the old MP software for a change.
To make a long story longer: That 859.50 - 863.50 is the critical zone to watch.
Click image for original size
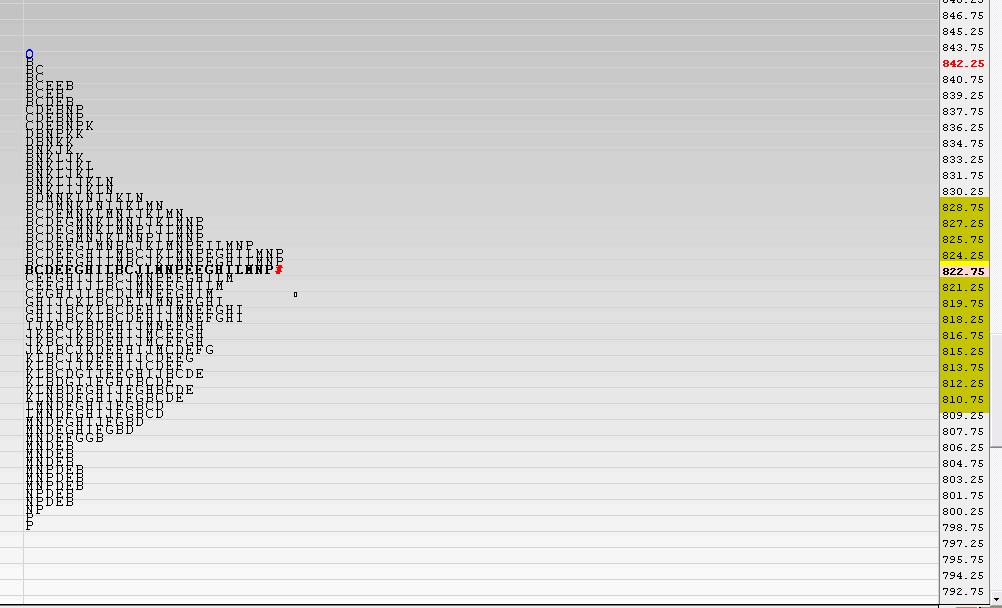
Oh yes Kool...that is the idea...we are basically looking for the profile to become "mature" and resemble the letter "D".....I have snapped two quick shots for you....
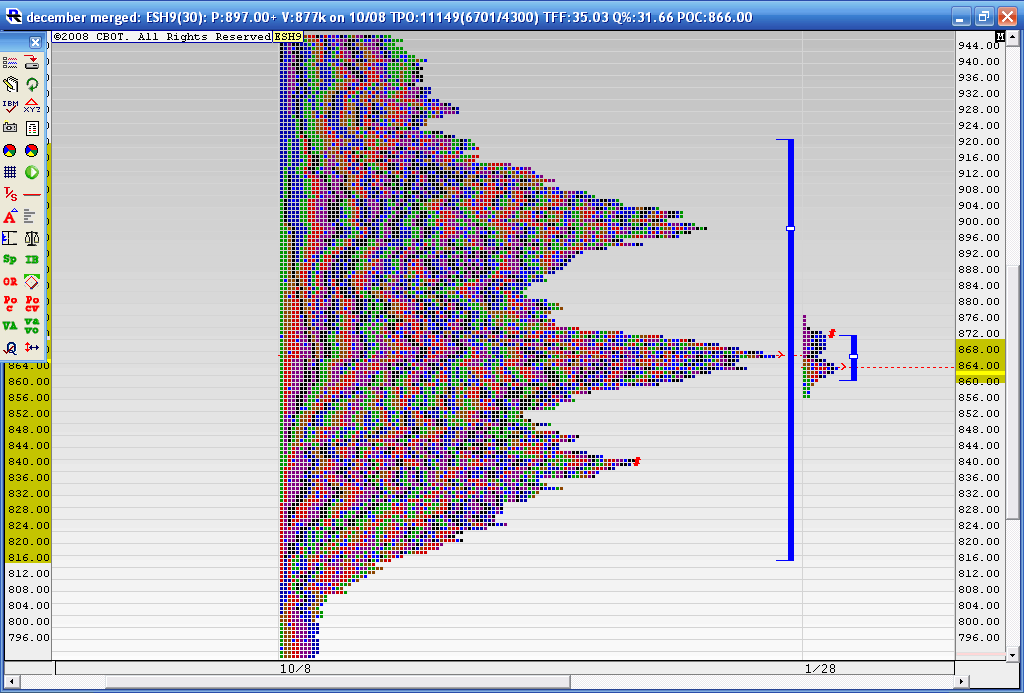
The first is all of last weeks trading merged into one.....You can see it resembles a capitol "D".....the "D" is nothing more than the bell shape curve turned on it's side....The value area represents the 1st Standard deviation ( Approximately)...So I turned the profile on it's side so you can see it as the bell curve...in the second screen shot
This is what I am thinking should happen with the current longer term profile I keep posting...I expect a capitol "D" to happen so we need to fill in the center some more.....I'm new to this longer term stuff too so thanks for your input
First chart is standard view....shape of the letter "D"...
Next is the same chart rotated to view as the BELL curve......
The profiles in general are far from perfect but this is what will proceed a break out from value.......these show the consolidation.....I don't think we will have any meaningful rally or decline until those "low" points in the longer term profile are filled in......then the MP players will look for a nice trend move to happen near the high volume node ( LOngest level of letters) and break away from it........we can apply this same logic on these weekly profiles I just posted here and the high volume node comes out at the 820 - 825 area......that will be the area to watch........
We have the Fed on wednesday so it will be interesting to see what happens leading up to that day
The first is all of last weeks trading merged into one.....You can see it resembles a capitol "D".....the "D" is nothing more than the bell shape curve turned on it's side....The value area represents the 1st Standard deviation ( Approximately)...So I turned the profile on it's side so you can see it as the bell curve...in the second screen shot
This is what I am thinking should happen with the current longer term profile I keep posting...I expect a capitol "D" to happen so we need to fill in the center some more.....I'm new to this longer term stuff too so thanks for your input
First chart is standard view....shape of the letter "D"...
Click image for original size
Next is the same chart rotated to view as the BELL curve......
Click image for original size

The profiles in general are far from perfect but this is what will proceed a break out from value.......these show the consolidation.....I don't think we will have any meaningful rally or decline until those "low" points in the longer term profile are filled in......then the MP players will look for a nice trend move to happen near the high volume node ( LOngest level of letters) and break away from it........we can apply this same logic on these weekly profiles I just posted here and the high volume node comes out at the 820 - 825 area......that will be the area to watch........
We have the Fed on wednesday so it will be interesting to see what happens leading up to that day
quote:
Originally posted by koolblue
Bruce, i wonder if it exceeds the 866 area and carries all the way to the 883 area to fill in that low spot between the 'mountains'? Im a newbie to market profile ,but ive noticed a tendancy for this to happen often!
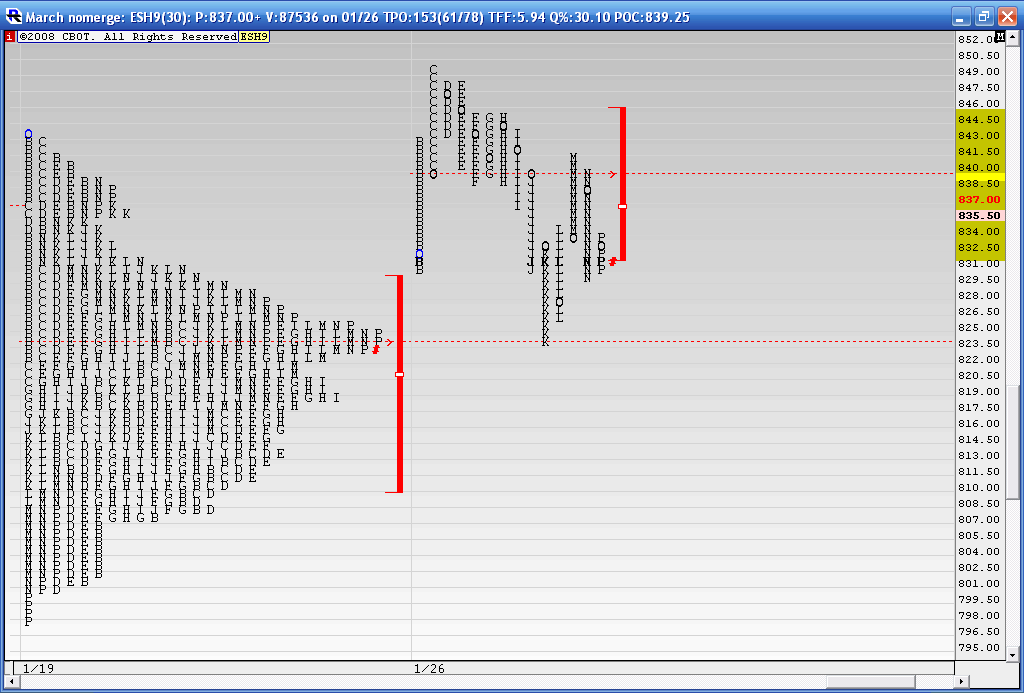
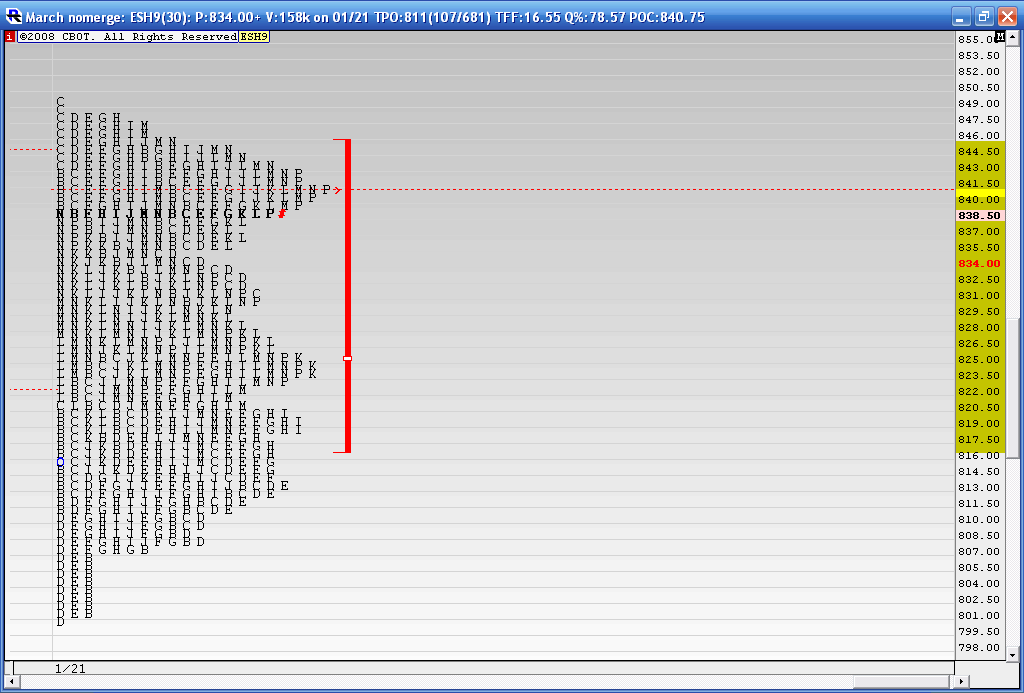
here is what happened today ......I'm showing the merged chart of last week ( same as the last post I made yesterday) but also have included todays trading....
They went for the breakout from the weekly value area from the start in the "B" period and then the weekly range breakout in the "c" PERIOD...the B and C are the first two 30 minutes of trading on my charts..........but then look what happens.........they can't break out of the top of the first hour high......Then we get a "P" formation if we combine the B-H periods....In general those signify " secret selling" formations/////we then rollover down to go test the POC from the weekly composite in the "K" period.
For those who don't have MP, you don't need it to see.....we tried to break out of a high and failed a fairly simple concept.......but MP can help... Here is the chart
Click image for original size
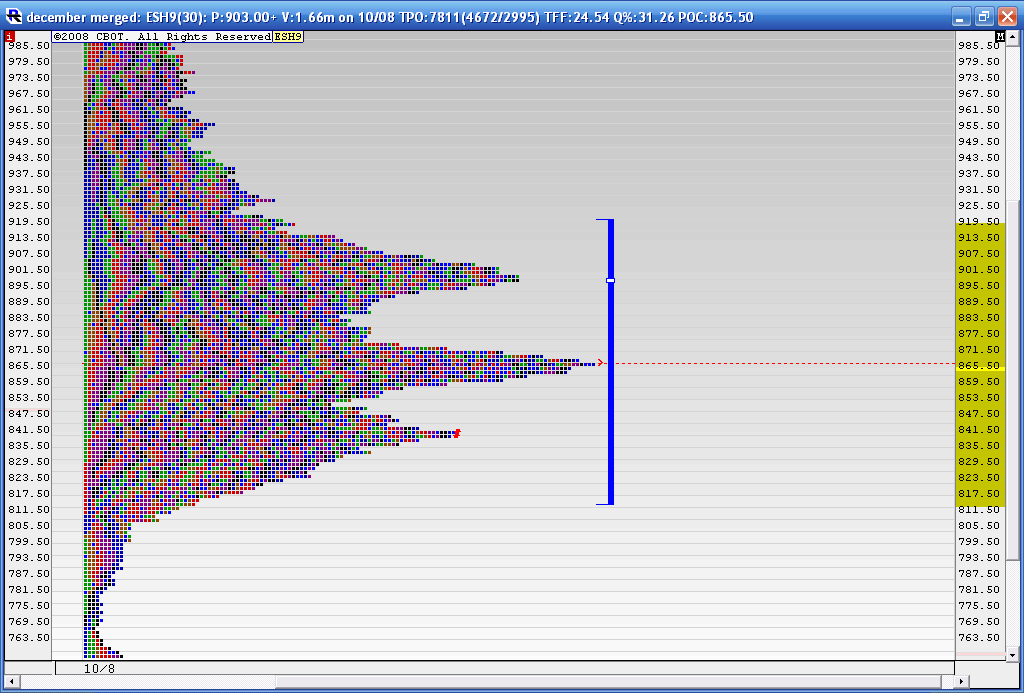
Here is how we are looking going into the fed day.....this is obviously the longer term that I started from October 8th...
The key areas
Low Volume on upside is
853
881.50
The high Volume is the 866 area and the 898
then we have the VA high all the way up at 919 - 920
On the downside we have high Volume at 839- 841 and then the Va low at the 818 - 820 area
I think this is gonna be a real whopper of a day after the announcement......just don't know what they really need to get done......My thoughts go to the upside as per this thread but everyone seems so damn bearish.......Good luck if you play tomorrow!!
Click image for original size
First off thanks for the great stuff you post day after day. Second Congratulations on the arrival of your new daughter.
As to the comundrum you pose as we wait for the FED to do its thing here are a few things to consider.
1) We have reached the POC of the merged MP that Bruce posted today. Dalton considers this a remarkable opportunity to open a trade. Dircetion??
2) We have had five connescutive days of increasing POCs - an up trend. A five day up trend in a bear market is an achievement initself. Can there posssibly be more? A break below 855.00 -856.00 would make it highly probable that the recent up trend is over.
3) The volume of the five day up trend has been sub par strongly suggesting that we are dealing with a correction of the main trend..
4) Levels of anticipated stiff resistance are 867.50 and 875.00.
As I wait I suspect that I am missing a low risk trade in this POC area to go short (I seldom trade ahead of the FOMC announcement) - a resumption of the trend.
great call for the 866 area we spoke about ,Bruce! you da man!!!!
thanks for posting these shots
YM and ES and $tick diverging at these 1:15 highs but I'm standing aside....if it was any other day I'd be shorting this key number......It sure seems like they want to clean up some downside pressure.......I'd personally Like to see the downside spike after the announcement and then the grind up again......but the real purpose of this thread is to let the profiles try and "speak" to us......most of us are fairly good with the short term analysis so lets see if they can eventually make this longer term profile "fill" out a bit in those low areas and form the "D" profile with long tails on both sides ..thanks for the feedback and the good words!!
While I have a moment to breathe//////here are the 5, 10 and 20 day rolling profiles...these are run up to yesterdays prices and don't include todays trading. My good friend David has inspired me along with the work of Don Jones to run these.........These are for reference and I'm not looking at this as part of the main thrust of this thread.....these show some additional levels that we may not find on these bigger profiles....for example...on the twenty day you can see the low volume at 856 ( Blue line) and you can see how that low volume area is acting like support in the RTH session so far today....
Here are the charts
Five day
Ten Day
Twenty Day
What's nice about using the 5 , 10 and twenty days is that we can also see where the breakout may come from for those who use 5, 10 and 20 day highs and lows to initiate trades.....
We know the Turtle soup folks will look at the 20 day highs and lows for example......
Perhaps this will be the start of another thread as a place to see the levels..unfortunately I have to scale the 20 day a lot to fit it on my screen but it seems to have some good areas to work from
Good luck
Bruce
Here are the charts
Five day
Click image for original size
Ten Day
Click image for original size
Twenty Day
Click image for original size
What's nice about using the 5 , 10 and twenty days is that we can also see where the breakout may come from for those who use 5, 10 and 20 day highs and lows to initiate trades.....
We know the Turtle soup folks will look at the 20 day highs and lows for example......
Perhaps this will be the start of another thread as a place to see the levels..unfortunately I have to scale the 20 day a lot to fit it on my screen but it seems to have some good areas to work from
Good luck
Bruce
So when I look at the 20 day merge that 841 - 836 is the giant magnet.....so IF I can get a short trade off after the announcement that will be my first critical target ....then that 825.....Ideal short Zone would happen for me up above the 890 ....into the 898 area.........that is where the most volume traded from the 20 day.....
Here is how our longer term profile is shaping up against the trading from today........I think that 866 number is going to be critical now and a retest down into the 840 area and then 825 is likely...
We have a selling tail on today's highs. I've heard that big money takes TIME to enter a position which is why these longer term profile numbers are not EXACT lines in the sand...they become areas of interest....You can see how todays profile fits in with the bigger picture......For me I'll also be monitoring that spike low of 862 to see if the market accelerates below there especially if we get a lower open...Here is the chart...seems like the market will need to take a breather before/IF it is going to resume it's climb up higher to fill in those low volume areas some more
We have a selling tail on today's highs. I've heard that big money takes TIME to enter a position which is why these longer term profile numbers are not EXACT lines in the sand...they become areas of interest....You can see how todays profile fits in with the bigger picture......For me I'll also be monitoring that spike low of 862 to see if the market accelerates below there especially if we get a lower open...Here is the chart...seems like the market will need to take a breather before/IF it is going to resume it's climb up higher to fill in those low volume areas some more
Click image for original size
We had a break out up on yesterdays high Volume fed announcement.....now we need to see if we can attract Volume above...my feeling is that they will fail on this breakout and we will get daily closes back below 867.....Sure hope I'm wrong for the longer term players like myself....I'll get a chart later
Emini Day Trading /
Daily Notes /
Forecast /
Economic Events /
Search /
Terms and Conditions /
Disclaimer /
Books /
Online Books /
Site Map /
Contact /
Privacy Policy /
Links /
About /
Day Trading Forum /
Investment Calculators /
Pivot Point Calculator /
Market Profile Generator /
Fibonacci Calculator /
Mailing List /
Advertise Here /
Articles /
Financial Terms /
Brokers /
Software /
Holidays /
Stock Split Calendar /
Mortgage Calculator /
Donate
Copyright © 2004-2023, MyPivots. All rights reserved.
Copyright © 2004-2023, MyPivots. All rights reserved.