Charts 1-6-2009
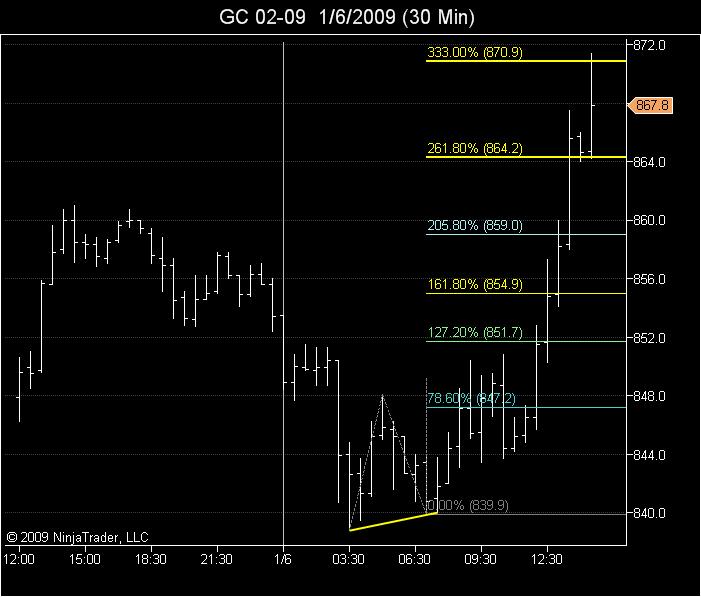
30 Minute chart of Gold !
Click image for original size


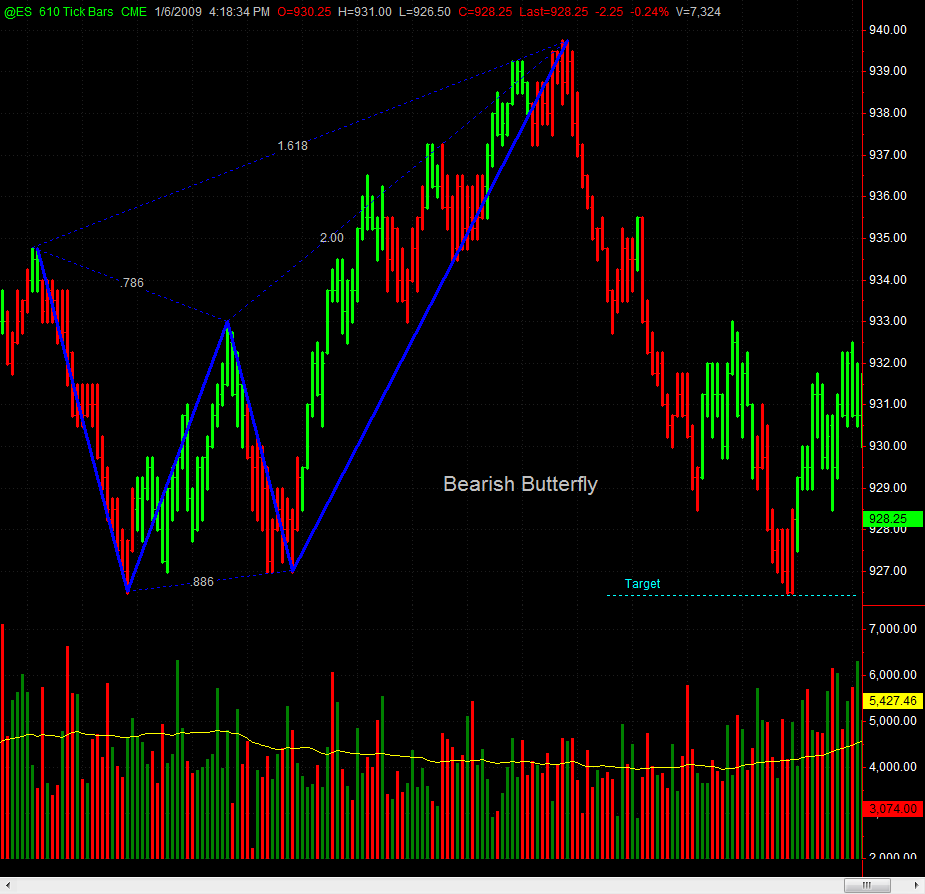
Bruce here is our shorts from around 39 ...although we made the trade for different reasons it sure worked out. I was too blinded by a bigger picture pattern to realize this had setup. I would have covered around 927 if i had been aware of the pattern.
Click image for original size
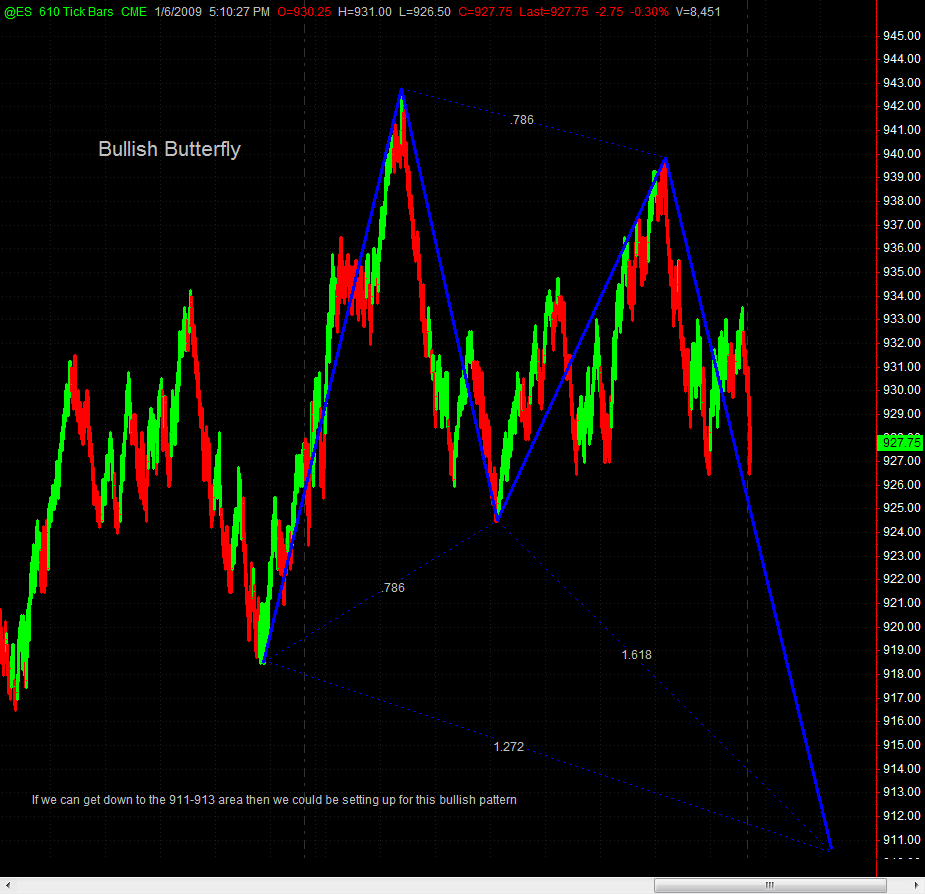
Here is the bigger picture pattern that had my attention.
Click image for original size
Great chart Vo! id say there's a fair chance of seeing those numbers develop!Closing tick today +1040 ... yesterday +813
In the last 5 trading days we have had only one day with closing Ticks less than 900 ( Wednesday) and that plus 1400 reading on Friday...does someone know something we don't..? Hope so
I have been pointing at the 910 level since early Monday morning. Given the confluence of this bigger butterfly pattern and these extreme closing tick readings, 910 remains a downside target for this week in my mind.
Also I noticed today the market has been rallying into news and collapsing when the news is actually released. Perhaps pump and dump is back in vogue.
Also I noticed today the market has been rallying into news and collapsing when the news is actually released. Perhaps pump and dump is back in vogue.
PT that is a GREAT look at Gold! There are so many instruments to trade with so many different periods to look at. I appreciate you posting this!
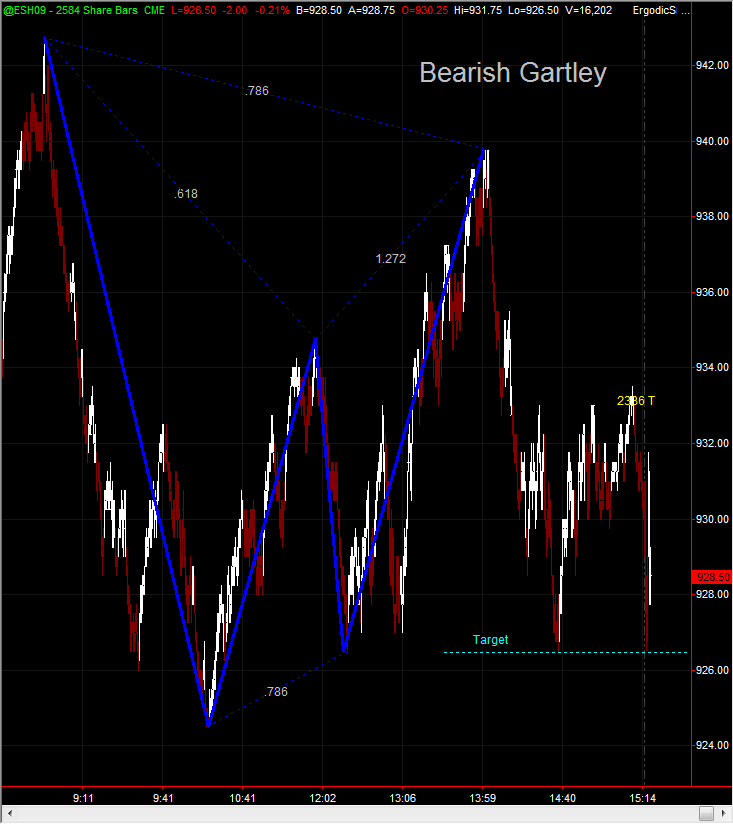
As I was studying my potential bullish butterfly pattern this caught my eye...I'm embarrassed to say I missed this one as well . BTW its 2nd target is around 914.
Click image for original size
Thanks for that chart Vo...it's always cool to see us all jumping in for different reasons....
"Bruce here is our shorts from around 39 ...although we made the trade for different reasons it sure worked out. I was too blinded by a bigger picture pattern to realize this had setup. I would have covered around 927 if i had been aware of the pattern."
"Bruce here is our shorts from around 39 ...although we made the trade for different reasons it sure worked out. I was too blinded by a bigger picture pattern to realize this had setup. I would have covered around 927 if i had been aware of the pattern."
Emini Day Trading /
Daily Notes /
Forecast /
Economic Events /
Search /
Terms and Conditions /
Disclaimer /
Books /
Online Books /
Site Map /
Contact /
Privacy Policy /
Links /
About /
Day Trading Forum /
Investment Calculators /
Pivot Point Calculator /
Market Profile Generator /
Fibonacci Calculator /
Mailing List /
Advertise Here /
Articles /
Financial Terms /
Brokers /
Software /
Holidays /
Stock Split Calendar /
Mortgage Calculator /
Donate
Copyright © 2004-2023, MyPivots. All rights reserved.
Copyright © 2004-2023, MyPivots. All rights reserved.