All I Want is This One Indicator..
tsunami-trade.com sells their indicators for tradestation for 6500$, tooooooo much with no assurances etc.
One of their indicators is called the trender line, a thick "moving average or smoothing line" that follows price and changes color from cyan to red for direction. Seems to be the only indicator of any value that he has.
MY REQUEST: ANYONE HAVE THIS INDICATOR? ALL I WANT IS THIS INDICATOR.
PLEASE REPLY
LIZ
Liz making the ma change colors is pretty simple...post a snap shot and I can prolly help
Before you go spending money just remember that the MACD is the mother indicator and is of great value. If you understand it alone you will get great results.
Look at a "Hull moving average" it's very similair to what you're referring to
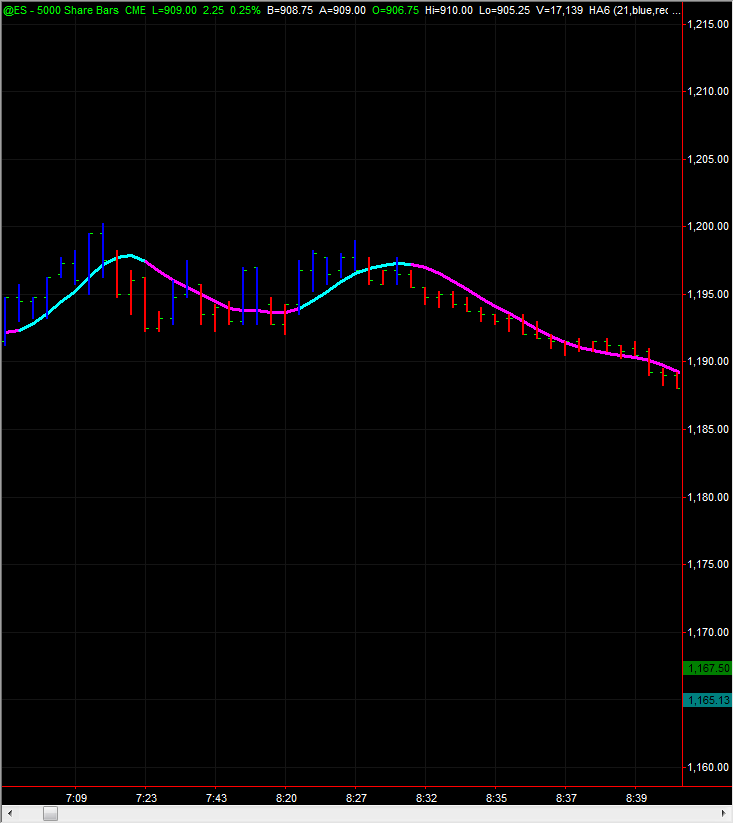
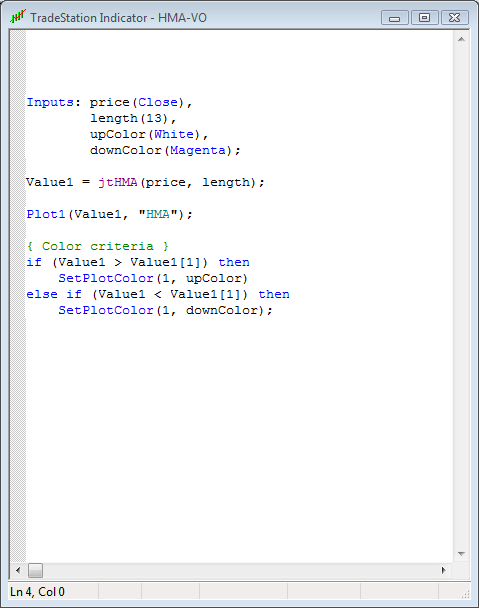
Liz here is the code for an HMA. Just copy it into a new EasyLanguage indicator. The default is 13, but in the picture I used 20 and it matches pretty close...play around with the numbers.
Click image for original size
Click image for original size
Click image for original size
Sorry about that Liz...you will need this function
Click image for original size
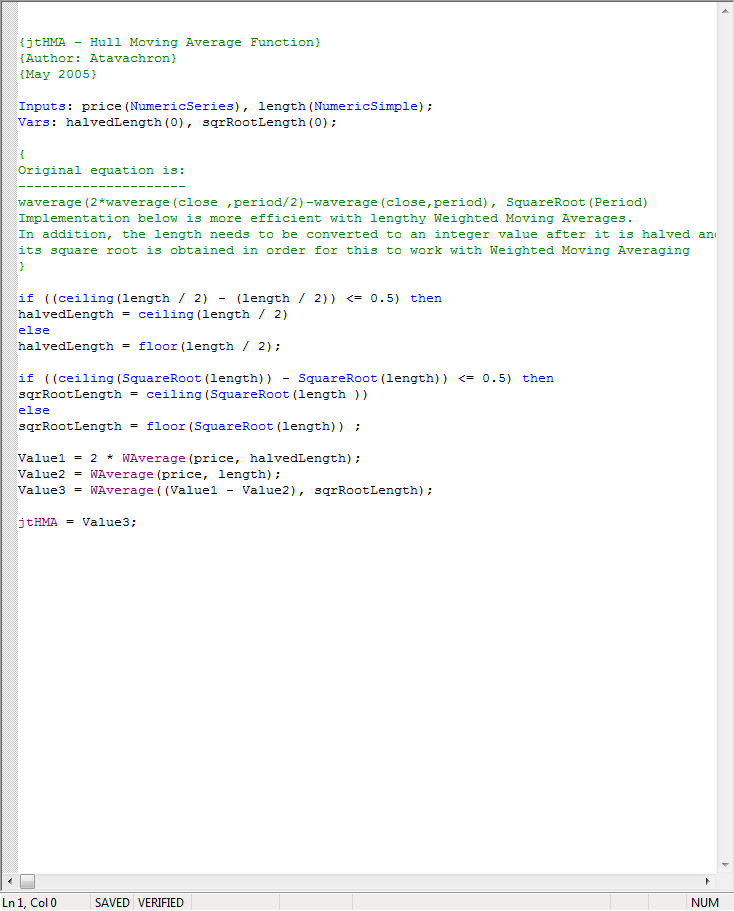
Click image for original size
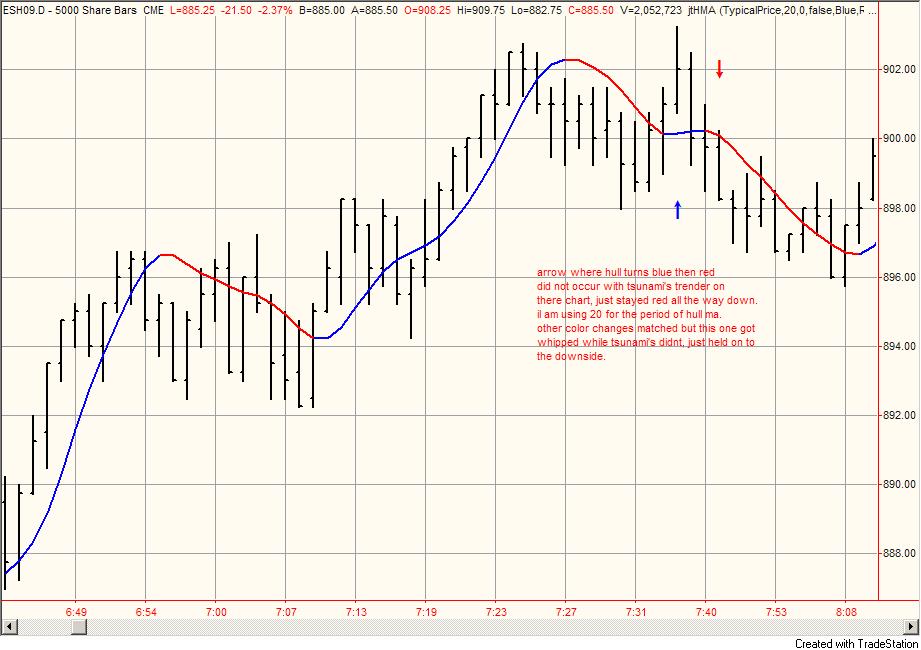
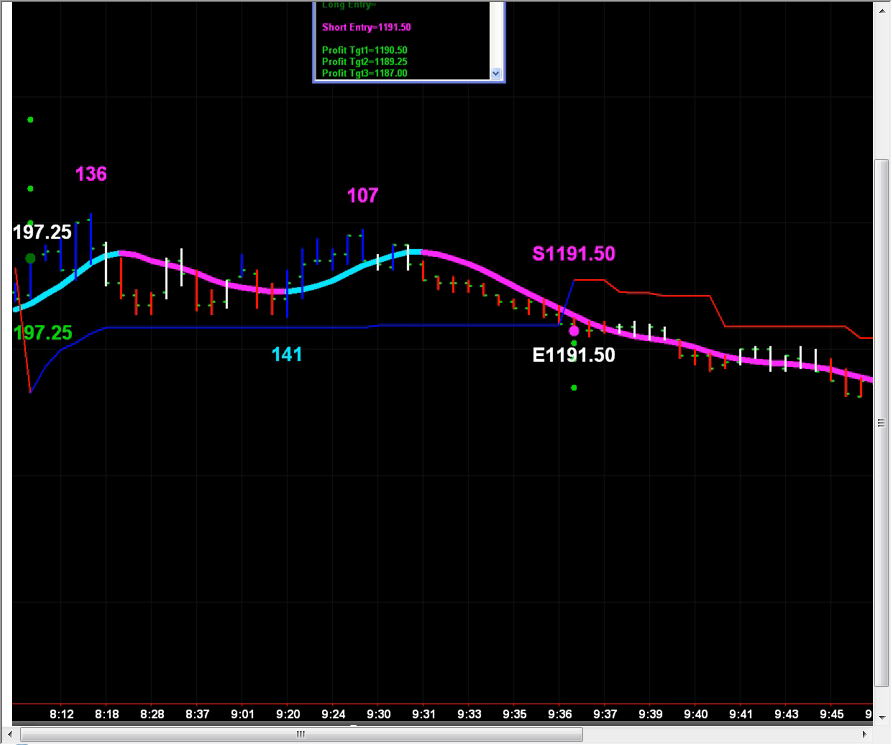
HERE IS A SNAPSHOT FROM MY TS, INDICATING DIVERGENCE BETWEEN TSUNAMI'S AND HULL, I TRIED DIFFERENT PARAMETERS FOR HULL, BUT NOTHING ELIMINATES THE WHIP AS NOTED O/N THE CHART WITHOUT ELIMINATING THE PRIOR MATCHES WITH TSUNAMI'S CHART.
CHART IS 12/11/08 ESH09 5000 SHARE BARS.
ANY IDEAS?
Liz. I understand if Tsunami is in a trade, the trender will stay the same color unless the stop loss is hit. In the example you posted, was Tsunami in a short?
I think it's more important to look at the big picture here. Tsunami is nothing more than a bunch of free, public domain indicators with a TradeStation Auto Trendline plotter and marketed for $5000. It's touted to work in any market and in any timeframe, but it won't and that's why it's demonstrated with a 5000 share chart which gives the best results. In fact, on certain tick bars, you will get a signal that is directly opposite of the 5000 share bar at exactly the same price in time. Of course, that makes no sense.
It pays to conduct a thorough due diligence analysis before buying any of these high priced trading gizmos. Remember, if they could mint money, the developers wouldn't be selling them to the public.
Emini Day Trading /
Daily Notes /
Forecast /
Economic Events /
Search /
Terms and Conditions /
Disclaimer /
Books /
Online Books /
Site Map /
Contact /
Privacy Policy /
Links /
About /
Day Trading Forum /
Investment Calculators /
Pivot Point Calculator /
Market Profile Generator /
Fibonacci Calculator /
Mailing List /
Advertise Here /
Articles /
Financial Terms /
Brokers /
Software /
Holidays /
Stock Split Calendar /
Mortgage Calculator /
Donate
Copyright © 2004-2023, MyPivots. All rights reserved.
Copyright © 2004-2023, MyPivots. All rights reserved.