ES 1-9-09
GM Traders
i need a 96.75 close before i get any hope
im hopeful again...now I need a 98.25 close to get cocky
quote:
Originally posted by VOwater
im hopeful again...now I need a 98.50 close to get cocky
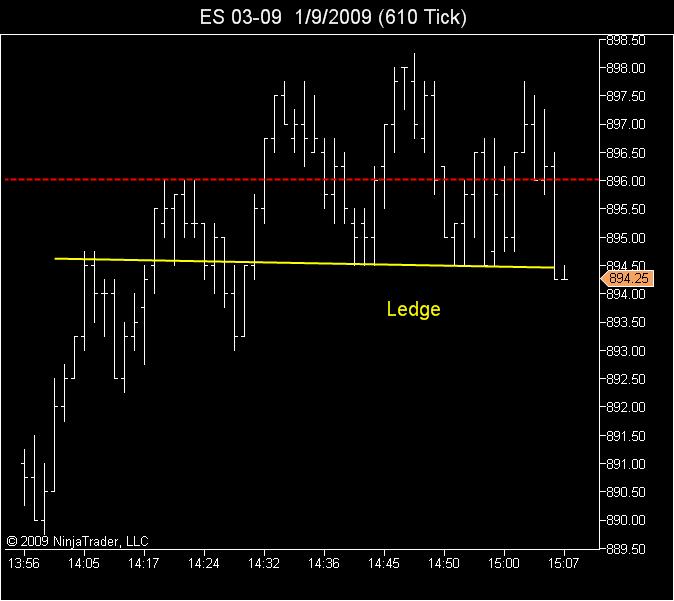
Combination of a chart ledge or shelf with confirmation of the T&S and DOM analysis. (ledges and shelves are very obvious on the 10,000V chart [or VO's 610 Tick chart] ) ... there is one at 894.50 right now i am watching very closely.
quote:
Originally posted by BruceM
did you see the buyers "camped" out due to your time and sales knowledge or was it just a visula thingquote:
Originally posted by pt_emini
quote:
Originally posted by BruceM
Pt ? did you see this....? if you have a chance...I know why I was/am monitoring the 90 area but always curious what the rest of the gang see..quote:
Originally posted by BruceM
please expand on that when you have time PTquote:
Originally posted by pt_emini
they have setup this 890 level
Sorry for the delayed reply Bruce, I was away for lunch.
1.Open a new chart. Hit the maximize button and expand it out so you can see everything since the RTH Open.
2.Draw 2 horizontal lines: Red line at 895, Green line 890
At the time of my original posting buyers were camped out on 890.00, which in my mind setup a failure point where they would sweep out sell stops later. Which they did several times today. Once 890 was swept clean of stops, any subsequent "breakdown" of 890 can be viewed as setting up a subsequent reversal trade for a run back to 895.
its a niagra falls ledge at 94.50
MAN OVERBOARD!
WOW, THEY JUST CANT GET THRU TAHT 897.75 AREA!...YET....
1 MIN PROJ. IS NOW 892.75
thanks PT...I appreciate the response...and yes...confluence on chart points and my reasons...I hear ya loud and clear....lol!!
Here is the Ledge at 894.50 I am referring to...
Click image for original size
quote:
Originally posted by vast524
Prestwick. Are you just reading this by the Dome and the T&S chart?
Regards
The singles were from the pit session TPOs. The read on big money net position is from a BAV chart.
Emini Day Trading /
Daily Notes /
Forecast /
Economic Events /
Search /
Terms and Conditions /
Disclaimer /
Books /
Online Books /
Site Map /
Contact /
Privacy Policy /
Links /
About /
Day Trading Forum /
Investment Calculators /
Pivot Point Calculator /
Market Profile Generator /
Fibonacci Calculator /
Mailing List /
Advertise Here /
Articles /
Financial Terms /
Brokers /
Software /
Holidays /
Stock Split Calendar /
Mortgage Calculator /
Donate
Copyright © 2004-2023, MyPivots. All rights reserved.
Copyright © 2004-2023, MyPivots. All rights reserved.