Charts 1-17-09
Click image for original size
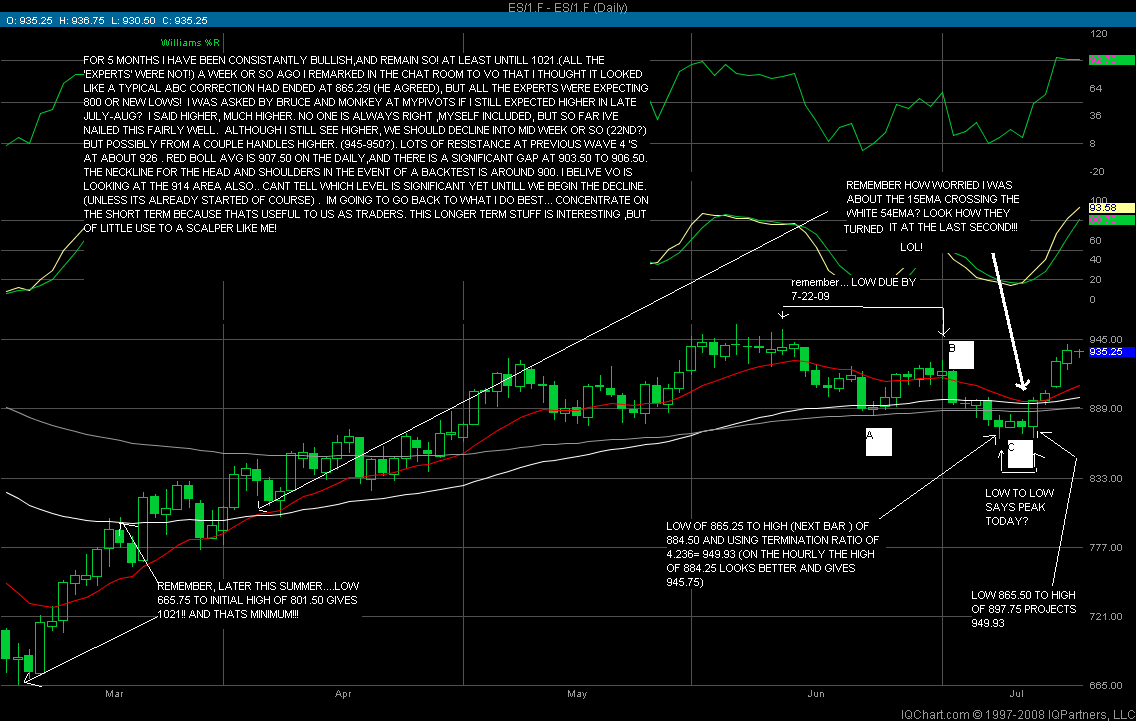
.......Ishould point out the white'average' (the 54 ema) is at 908 and falling!
Gonna be a fun week for bulls and bears!
Closing tick +985 .... and you know what that means!
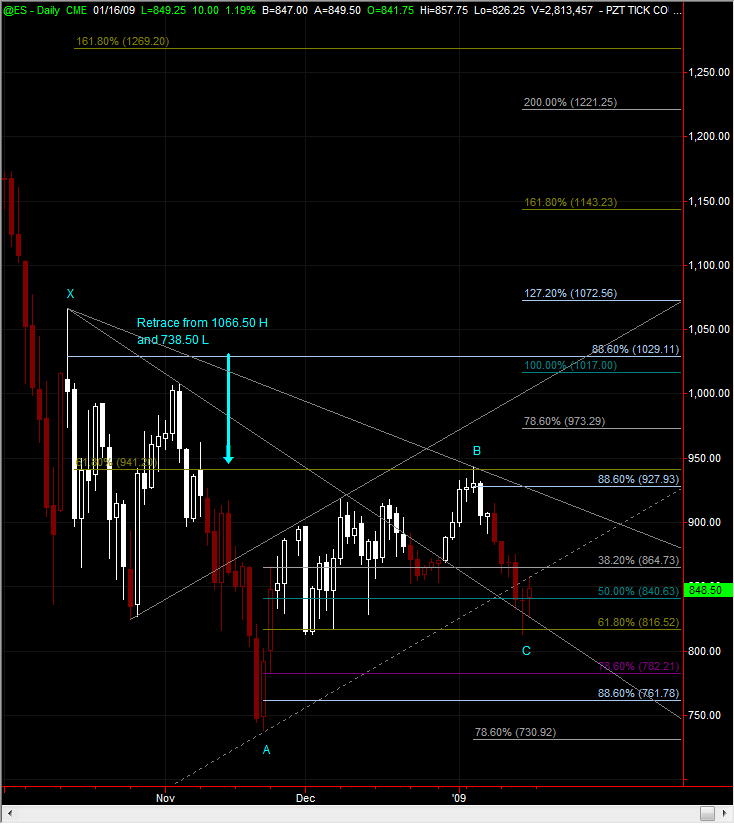
There are a couple of potential bearish harmonic patterns that may be setting up that we should keep an eye on. The good news (if your long) is that prices will need to go much higher for patterns to complete.
I have marked the X, A, B, and C levels on chart. If the BC leg is complete, which time will tell, we need to pay special attention to the 78.6% retrace of the XA leg at the 996 level. If we fail the 996 area (assuming we get that far) we would be setup for a Bearish Gartley. The downside targets would start with the C and A levels and end up at the 127.2% and 161.8% extensions of the AD leg.
The second scenario would be if we get crazy and they find a way to take prices to the 161.8% extension of XA leg around 1270. If at that point we fail then we would have setup a Bearish Crab. The targets would be The B, C and A levels.
It's worth noting that we may be developing a smaller Bullish Gartley. If the current upswing (last 2 days lol) continues for a retrace of the AB leg (BC on chart) and fails prior to taking out the 941 level then we would want to pay attention to the 78.6% of the XA leg (AB on chart) at 782. If we were to get that far and they turned her back up the Gartley would be setup with targets first at the C and A levels and then the 127.2% and 161.8% extensions of the AD leg.
Lots of IF's. As I stated earlier, these are potential patterns that will require work and time to develope, if at all.
Click image for original size
NQ has its own harmonic patterns in potential development. It is currently working on a Bearish Bat or Bearish Crab. It also has the potential for a smaller Bullish Gartley like the ES.
Click image for original size

Click image for original size
Click image for original size
Click image for original size
Click image for original size

Click image for original size
Click image for original size

Click image for original size
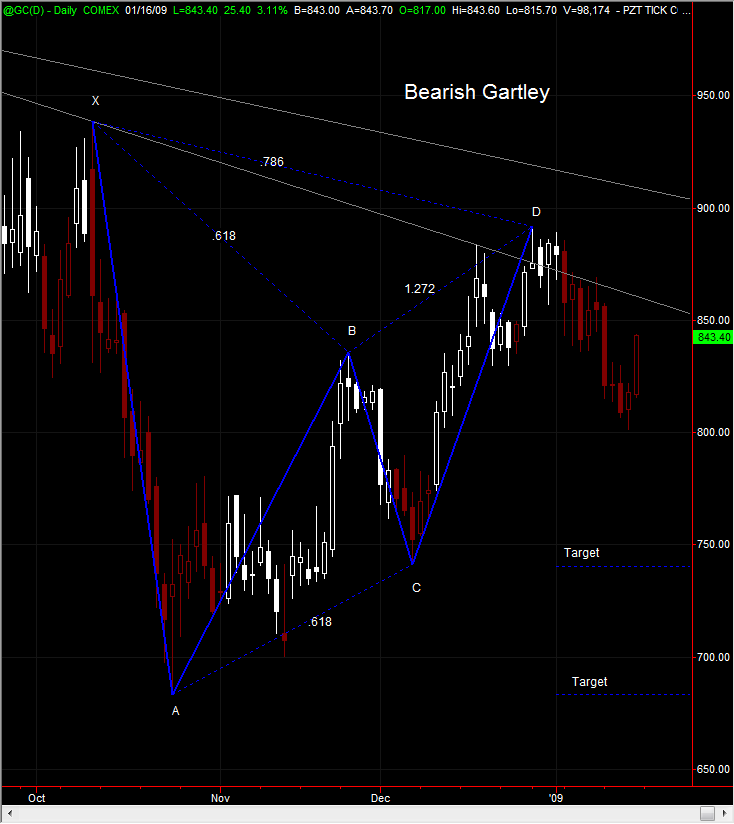
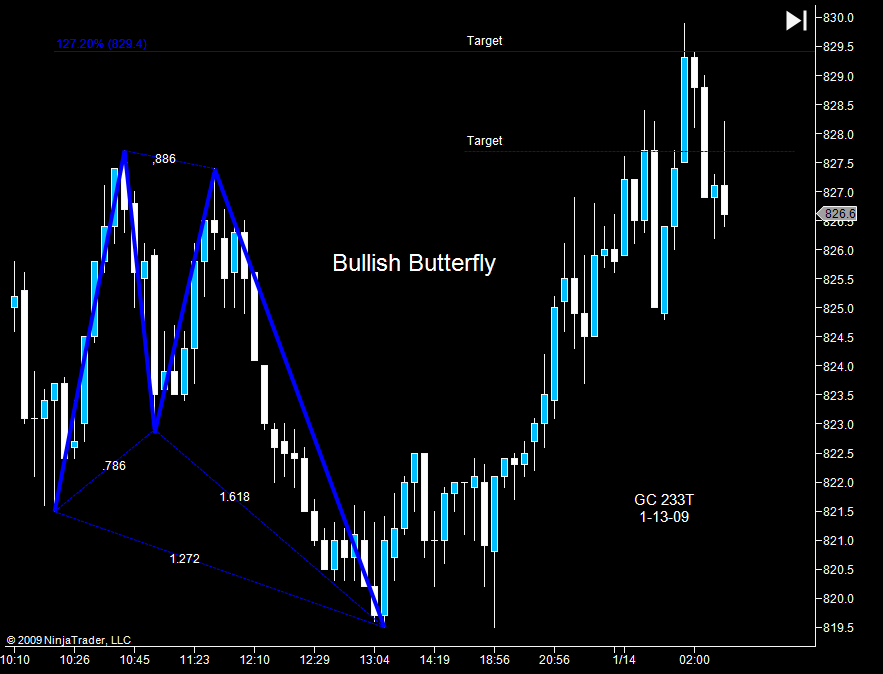
GC: Gold has had an explosive two day rally off 800. How far can GC go up and still stay within the bearish gartley pattern (meaning the pattern is still valid) ?
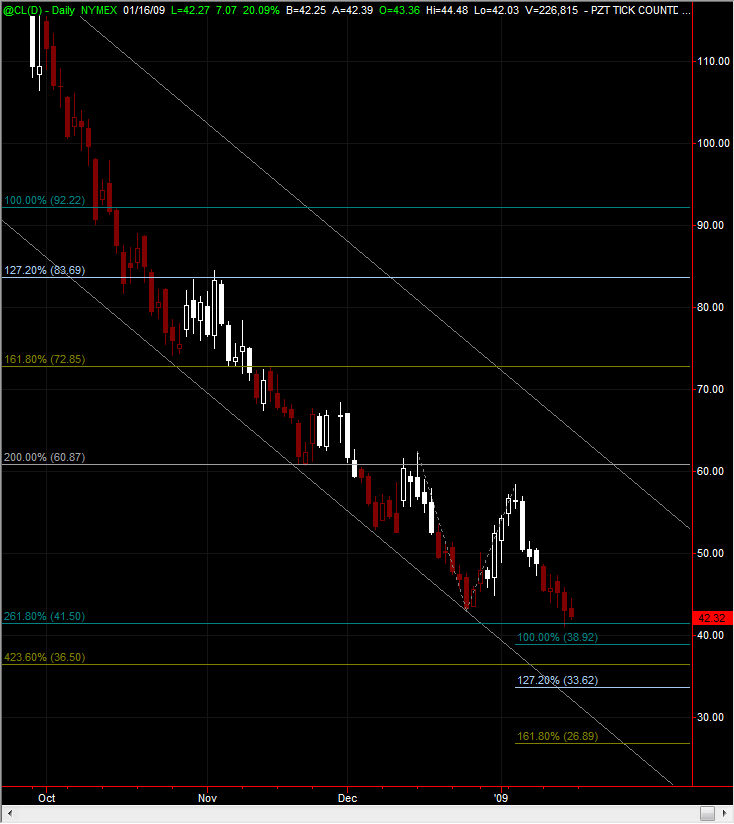
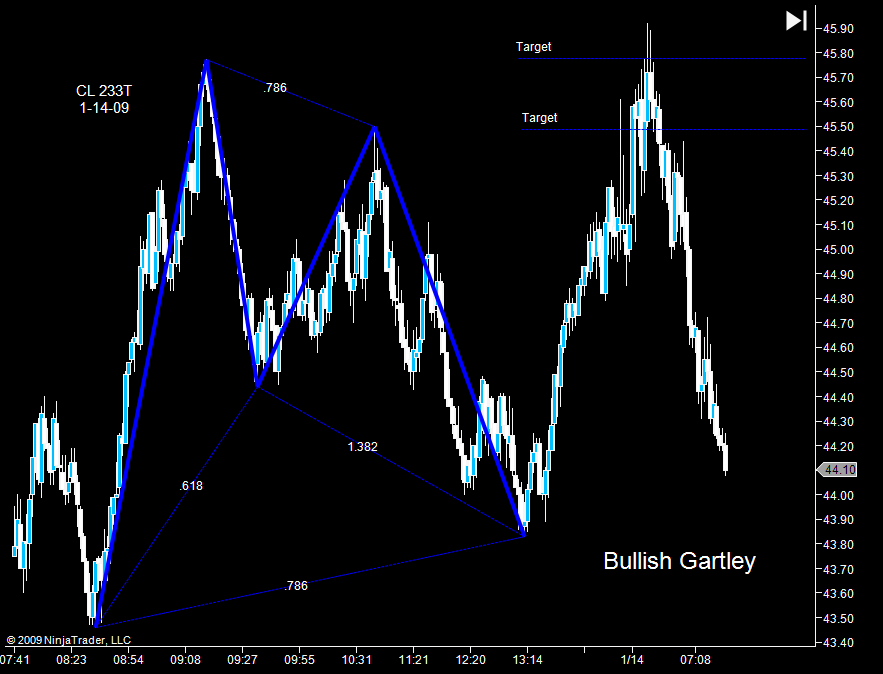
CL: watch that low for a 2-B to trigger a buy signal. I took note in Larry's weekly newsletter his mention of the bullish divergence in Heating oil and gasoline.
PT...if Gold takes out the D point it is a failed pattern, however, it can turn into a Crab at the 161.8% of XA (~1,100). As far as Crude it is setting up for bullish pattern on the 233T. I will post a chart soon.
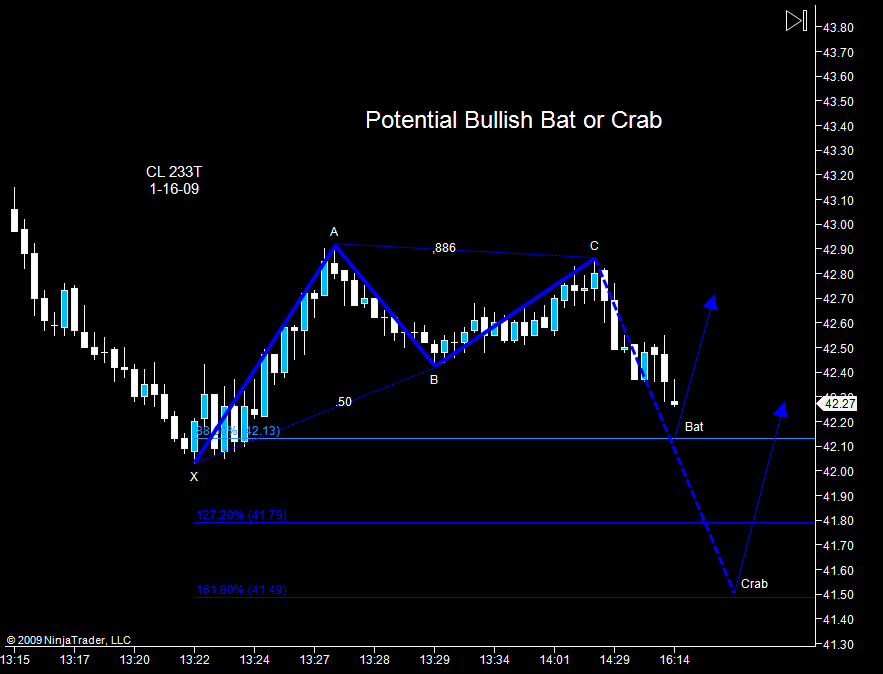
Here is the potential harmonic patterns that may be setting up with Crude. If they turn the CD leg at the 88.6% retrace then this will qualify as a Bullish Bat with first target at A. If they take the CD leg down to the 1.618% retrace and turn it back up then this will qualify as a Bullish Crab. Crude is also at or near support. These are potential patterns.
Click image for original size
Emini Day Trading /
Daily Notes /
Forecast /
Economic Events /
Search /
Terms and Conditions /
Disclaimer /
Books /
Online Books /
Site Map /
Contact /
Privacy Policy /
Links /
About /
Day Trading Forum /
Investment Calculators /
Pivot Point Calculator /
Market Profile Generator /
Fibonacci Calculator /
Mailing List /
Advertise Here /
Articles /
Financial Terms /
Brokers /
Software /
Holidays /
Stock Split Calendar /
Mortgage Calculator /
Donate
Copyright © 2004-2023, MyPivots. All rights reserved.
Copyright © 2004-2023, MyPivots. All rights reserved.