Larry Pesavento's Insights on the Markets & Charts
Click image for original size
Click image for original size
go ahead jim, and thanks i'm challenged computer wise, tha nip from 850-70 should provide resistance, i think rfarina is right and you could start building a short here with a stop above 875 area
i will be alert... fib traders know how the .886 is frequently reflected by 1.128... medianline traders look for price at line.... gann traders key on 720 degrees around sq9 upper green is 720 of march low.
Click image for original size
again, my focus is on the levels where the three groups are looking for a change... the 540 degrees is a key level to look for change to the gann traders.. upper green is 540 from march low...i simply see this level as the first serious challenge to the uptrend since the march low... what happens here will be telling...the most important lesson i learned years ago was this'' as price approaches an im portant pivot, the tools will work better and better on smaller time frames, traders become mesmerized by their success and lose sight of the bigger picture.. that is what happened on friday.. it took my current student to point that out to me as i was down trading the tools on the
one minute.. thanks.
one minute.. thanks.
Click image for original size
MONDAY APRIL 13TH HAS A HIGH PROBABILITY OF A SHORT TERM TOP IN THE STOCK MARKET -THIS REPORT IS BASED O/N A SEVERAL OBSERVATIONS --
1-THE BRADLEY STOCK MARKET MODEL IS NEAR A SHORT TERM PEAK
2-THE VIX INDEX IS COMPLETING AN AB=CD PATTERN AT THE OLD
HIGHS WERE THE BREAKDOWN IN STOCKS ACCELERATED -THIS
IS IMPORTANT FROM AN HISTROICAL PROSPECTIVE AS OLD HIGHS
AND LOWS BECOME SUPPORT AND RESISTANCE
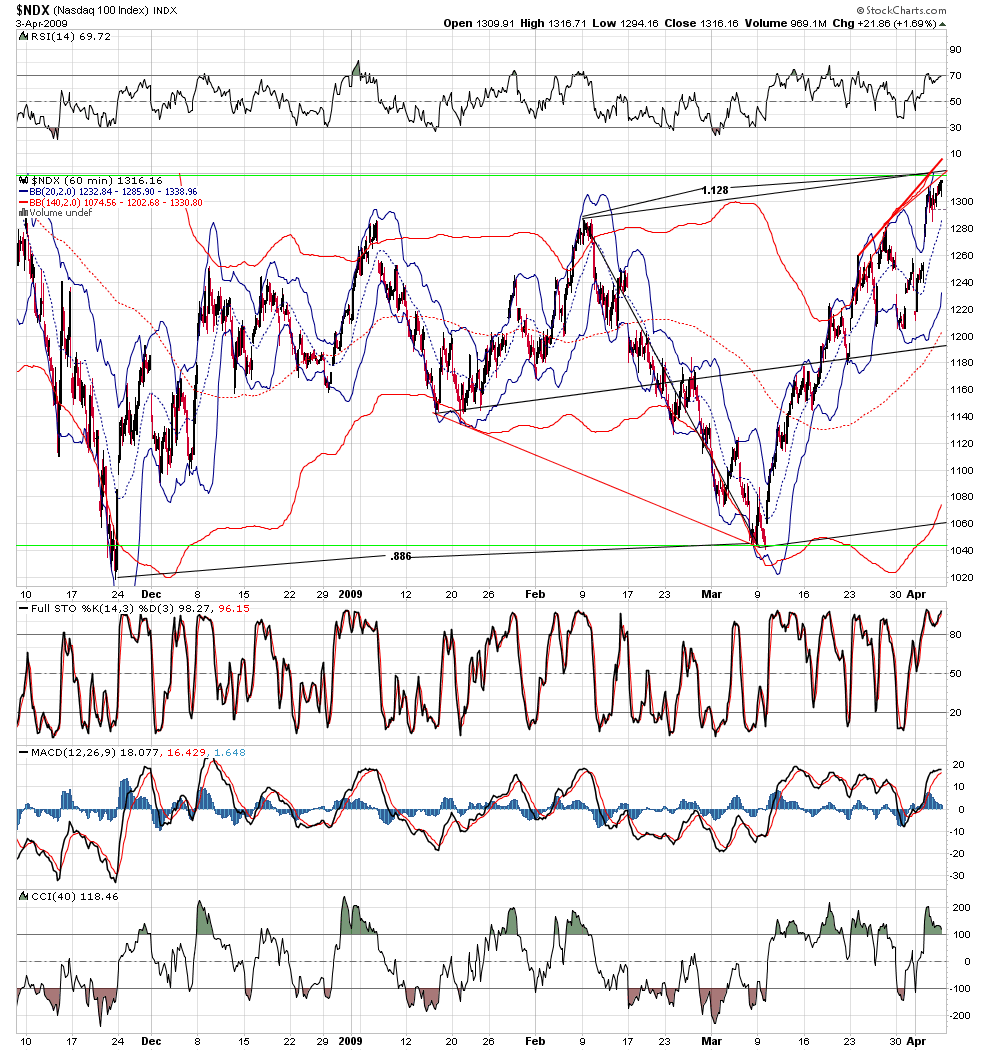
3-THE NASDAQ HAS COMPLETED A PERFECT AB=CD PATTERN O/N
THE DAILY CHART
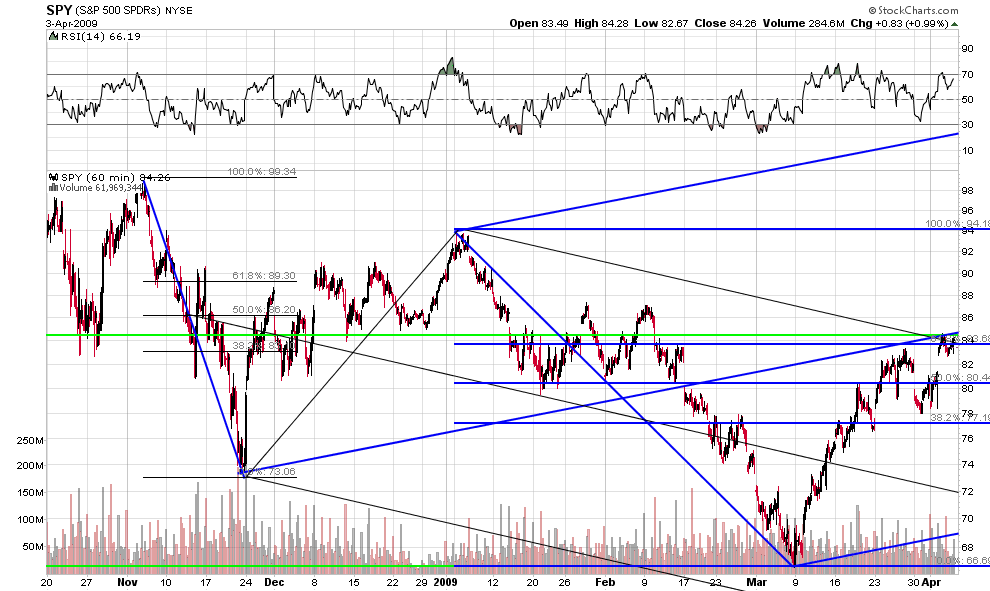
4 - THE SP 500 HAS MADE A 618 RETRACEMENT OF THE LAST HIGH
5 -THERE IS A STRONG ASTRO HARMONIC DUE APRIL 20TH THAT
COULD PULL STOCKS LOWER MAKING A NORMAL CORRCTION
OF THE LAST UP MOVE FROM MARCH 6TH
CAVEAT EMPTOR ( buyer beware )
Should the S&P 500 go above 865 Monday then I would view this analysis
With specticisim --A move down to approx 792 would be a normal correction
1-THE BRADLEY STOCK MARKET MODEL IS NEAR A SHORT TERM PEAK
2-THE VIX INDEX IS COMPLETING AN AB=CD PATTERN AT THE OLD
HIGHS WERE THE BREAKDOWN IN STOCKS ACCELERATED -THIS
IS IMPORTANT FROM AN HISTROICAL PROSPECTIVE AS OLD HIGHS
AND LOWS BECOME SUPPORT AND RESISTANCE
3-THE NASDAQ HAS COMPLETED A PERFECT AB=CD PATTERN O/N
THE DAILY CHART
4 - THE SP 500 HAS MADE A 618 RETRACEMENT OF THE LAST HIGH
5 -THERE IS A STRONG ASTRO HARMONIC DUE APRIL 20TH THAT
COULD PULL STOCKS LOWER MAKING A NORMAL CORRCTION
OF THE LAST UP MOVE FROM MARCH 6TH
CAVEAT EMPTOR ( buyer beware )
Should the S&P 500 go above 865 Monday then I would view this analysis
With specticisim --A move down to approx 792 would be a normal correction
Stock market
Stocks continued their rally into the sixth week from the March 6 low. This rally has affected all areas of the globe. The week of April 20 is supposed to be a very important week. It equals the last rally that we had before the March low and also fits in with the scenario of a potential short-term top in the timeframe between April 13 and the 20th. Originally, I had expected the market to top on 13 April and then pull down hard into 20 April. The continued rally into April 20 makes it a high probability of a top of some magnitude. However it is also possible that the market could accelerate from this point and continue to run for several more weeks. Statistically a market that has been up six weeks in a row has a better than 85% chance of correcting at least one or two weeks before continuing the upward leg. Should the S&P 500 futures go above 885 on Monday or Tuesday it would most probably mean that the stocks are going to continue higher possibly all the way into July. If the market does start down on 20 April it would mean the market is having its first potential correction since the March 6 low. Ideally, we would like to see the market back off to the 750 area i.e. the 618 retracement, and then continue on higher until July. It is our opinion that we are still in a major bear market that will not make his final bottom in too late 2011 or 2012.
Treasury bonds
This market continues to drift lower. Even the Federal Reserve Board announcement that they were purchasing 300 billion of treasury bonds failed to rally the bonds. It seems rather odd that the Federal Reserve would tell people what they are doing in the treasury bond market. Could it be that it is just a smokescreen so that they can sell some treasury bonds. There is a key level in treasury bonds at 122 and any move below that will signal substantially lower prices in the coming weeks and months. Our target for bonds will be near par or 100. This is a long-term target that should take the rest of the year to complete. Any rally into the 132 area would be considered a good entry point.
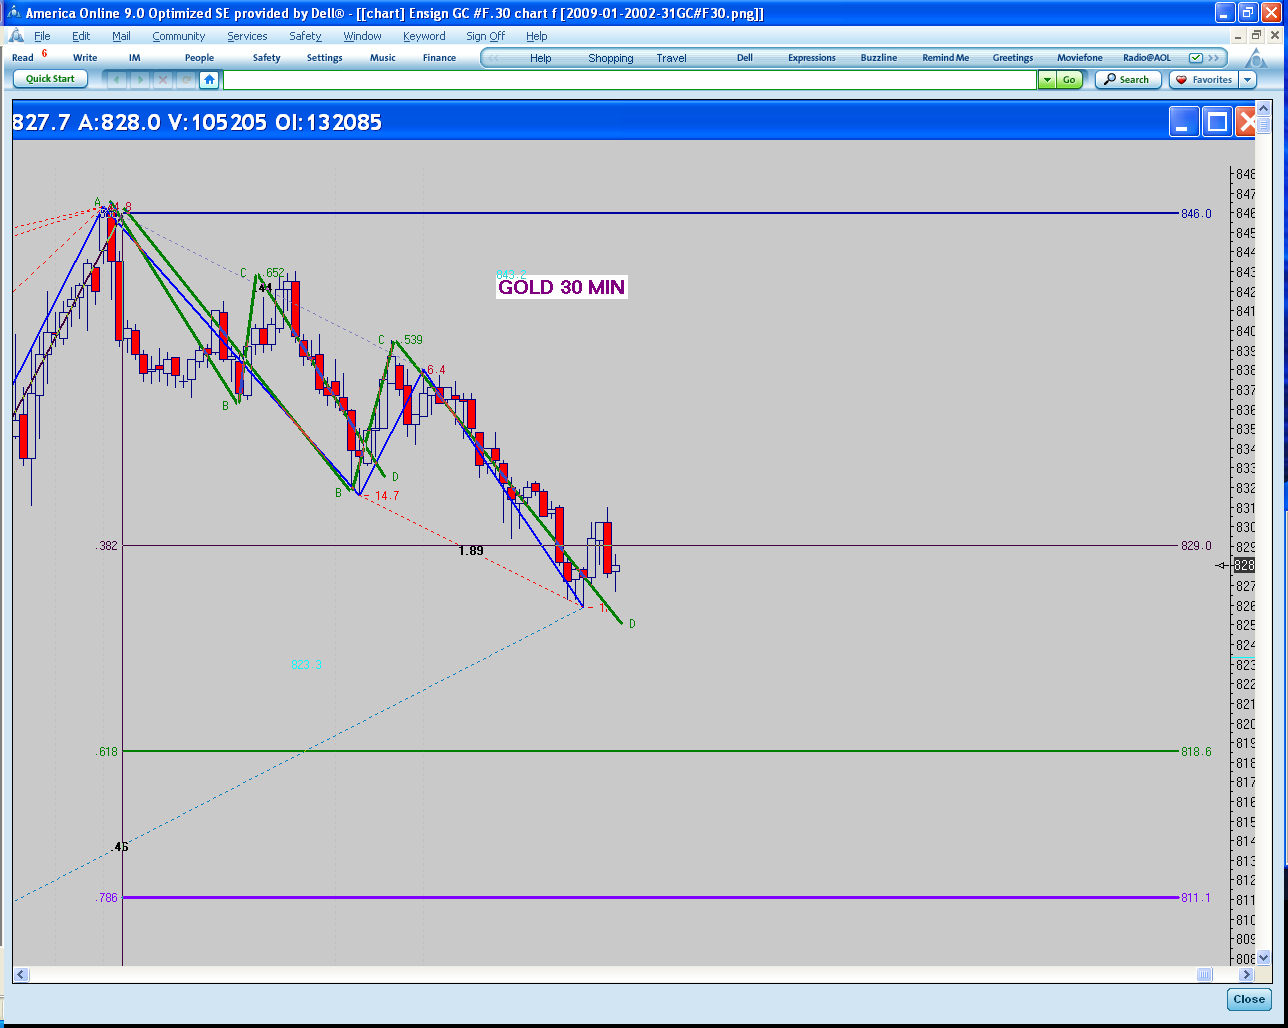
Gold
Gold is approaching the major support at the 849 level per ounce. Failure to hold this level would put gold closer to the 618 retracement of the larger bottom at $810 per ounce. It seems rather strange that gold do not expose to the upside during the recent financial crisis. In fact there is still a strong probability that a major double top has formed $1000 per ounce. Any close below $800 per ounce would most probably give the double top formation a distinct possibility. It's
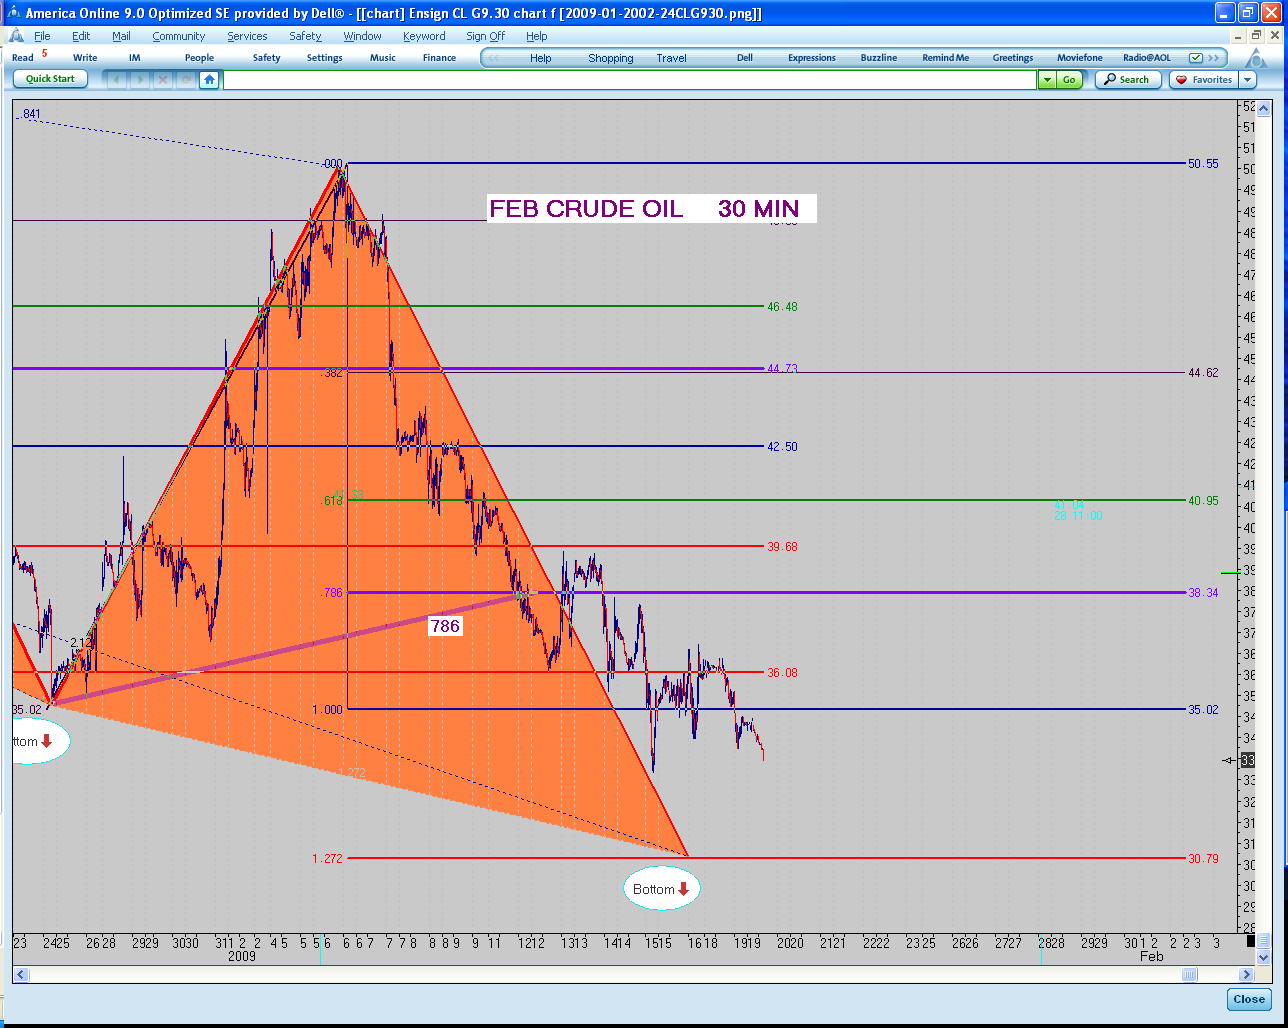
Crude oil
Crude oil has held its rally from the $34 per barrel level to the $55 level without correcting any significance amount. Should oil back off to the 618 retracement at the $42 per barrel level it would give us a very strong interest in becoming long crude oil. Eventually we think this market could get back to the $70 per barrel area but it is still in a major bear market as are most commodities with goal being the only seed exception.
Foreign currency
The euro is approaching a major Fibonacci level at the 618 retracement and completing a bullish Gartley pattern at the 1.2940 level. This is a very symmetrical pattern and should offer a low risk buying opportunity in the euro. However there is also a distinct possibility that we could make the 786 which is another 200 points lower. At this level 50 pips would be inadequate stop protection. We will send out a special alert if in fact this trade set up completes as expected. The Japanese yen is forming a textbook example of a pennant or flight formation. We have been following this for quite some time and it appears they was getting ready to make a move of substantial proportions. The problem is that it could be either up or down. The clue will be how quickly it moves away from this congestion area at the tip of the pennant.
Grains and oilseeds
November soybeans have completed a perfect Gartley sell signal. November beans our new crop soybeans that it just begin planting. July soybeans or old crop have had a substantial rally indicating that the demand for soybeans has not been reduced by higher prices. Soybeans have an elastic demand. This means that no matter what the price users will continue to use soybeans in their cooking and diets no matter what the price. Soybeans have long been touted as the world's most perfect food because of its distribution of carbohydrates proteins and fats. The peanut is a close second. However soybeans have tremendous amount of industrial uses in painting, synthetic margarine, cattle and chicken feed, and many other uses. We would suggest trying to find the low was short level in the November beans near the close of Friday, April 17, looking for you at least a one dollar per bushel corrections. No more than $1000 should be at risk in this situation.
Stocks continued their rally into the sixth week from the March 6 low. This rally has affected all areas of the globe. The week of April 20 is supposed to be a very important week. It equals the last rally that we had before the March low and also fits in with the scenario of a potential short-term top in the timeframe between April 13 and the 20th. Originally, I had expected the market to top on 13 April and then pull down hard into 20 April. The continued rally into April 20 makes it a high probability of a top of some magnitude. However it is also possible that the market could accelerate from this point and continue to run for several more weeks. Statistically a market that has been up six weeks in a row has a better than 85% chance of correcting at least one or two weeks before continuing the upward leg. Should the S&P 500 futures go above 885 on Monday or Tuesday it would most probably mean that the stocks are going to continue higher possibly all the way into July. If the market does start down on 20 April it would mean the market is having its first potential correction since the March 6 low. Ideally, we would like to see the market back off to the 750 area i.e. the 618 retracement, and then continue on higher until July. It is our opinion that we are still in a major bear market that will not make his final bottom in too late 2011 or 2012.
Treasury bonds
This market continues to drift lower. Even the Federal Reserve Board announcement that they were purchasing 300 billion of treasury bonds failed to rally the bonds. It seems rather odd that the Federal Reserve would tell people what they are doing in the treasury bond market. Could it be that it is just a smokescreen so that they can sell some treasury bonds. There is a key level in treasury bonds at 122 and any move below that will signal substantially lower prices in the coming weeks and months. Our target for bonds will be near par or 100. This is a long-term target that should take the rest of the year to complete. Any rally into the 132 area would be considered a good entry point.
Gold
Gold is approaching the major support at the 849 level per ounce. Failure to hold this level would put gold closer to the 618 retracement of the larger bottom at $810 per ounce. It seems rather strange that gold do not expose to the upside during the recent financial crisis. In fact there is still a strong probability that a major double top has formed $1000 per ounce. Any close below $800 per ounce would most probably give the double top formation a distinct possibility. It's
Crude oil
Crude oil has held its rally from the $34 per barrel level to the $55 level without correcting any significance amount. Should oil back off to the 618 retracement at the $42 per barrel level it would give us a very strong interest in becoming long crude oil. Eventually we think this market could get back to the $70 per barrel area but it is still in a major bear market as are most commodities with goal being the only seed exception.
Foreign currency
The euro is approaching a major Fibonacci level at the 618 retracement and completing a bullish Gartley pattern at the 1.2940 level. This is a very symmetrical pattern and should offer a low risk buying opportunity in the euro. However there is also a distinct possibility that we could make the 786 which is another 200 points lower. At this level 50 pips would be inadequate stop protection. We will send out a special alert if in fact this trade set up completes as expected. The Japanese yen is forming a textbook example of a pennant or flight formation. We have been following this for quite some time and it appears they was getting ready to make a move of substantial proportions. The problem is that it could be either up or down. The clue will be how quickly it moves away from this congestion area at the tip of the pennant.
Grains and oilseeds
November soybeans have completed a perfect Gartley sell signal. November beans our new crop soybeans that it just begin planting. July soybeans or old crop have had a substantial rally indicating that the demand for soybeans has not been reduced by higher prices. Soybeans have an elastic demand. This means that no matter what the price users will continue to use soybeans in their cooking and diets no matter what the price. Soybeans have long been touted as the world's most perfect food because of its distribution of carbohydrates proteins and fats. The peanut is a close second. However soybeans have tremendous amount of industrial uses in painting, synthetic margarine, cattle and chicken feed, and many other uses. We would suggest trying to find the low was short level in the November beans near the close of Friday, April 17, looking for you at least a one dollar per bushel corrections. No more than $1000 should be at risk in this situation.
The Stock Indexes are climbing a wall of worry. Classic.
The stock market attempted to make new highs again today. In fact, the
NASDAQ was able to make new highs. This presents a potential problem for the
Bears, or a great opportunity. Divergence between similar contracts can be
highly indicative of a major trend change. As you can see from the enclosed
chart, the NASDAQ easily exceeded last week's highs, while at the same time
the S&P 500 (i.e. Dow Jones also) were unable to do so! The bearish case is
still up for grabs. Any move in the S&P 500 above 875 would mean that we are
going higher. The figure for the Dow Jones is 8112. This week will be
critical to what happens going into May 18th which is our next Astro
harmonic date( combust ).
This weekend we will present a comprehensive pattern analysis on all the
major markets as we are approaching some completion of very significant
patterns.
Emini Day Trading /
Daily Notes /
Forecast /
Economic Events /
Search /
Terms and Conditions /
Disclaimer /
Books /
Online Books /
Site Map /
Contact /
Privacy Policy /
Links /
About /
Day Trading Forum /
Investment Calculators /
Pivot Point Calculator /
Market Profile Generator /
Fibonacci Calculator /
Mailing List /
Advertise Here /
Articles /
Financial Terms /
Brokers /
Software /
Holidays /
Stock Split Calendar /
Mortgage Calculator /
Donate
Copyright © 2004-2023, MyPivots. All rights reserved.
Copyright © 2004-2023, MyPivots. All rights reserved.