Reversals with EMA 54
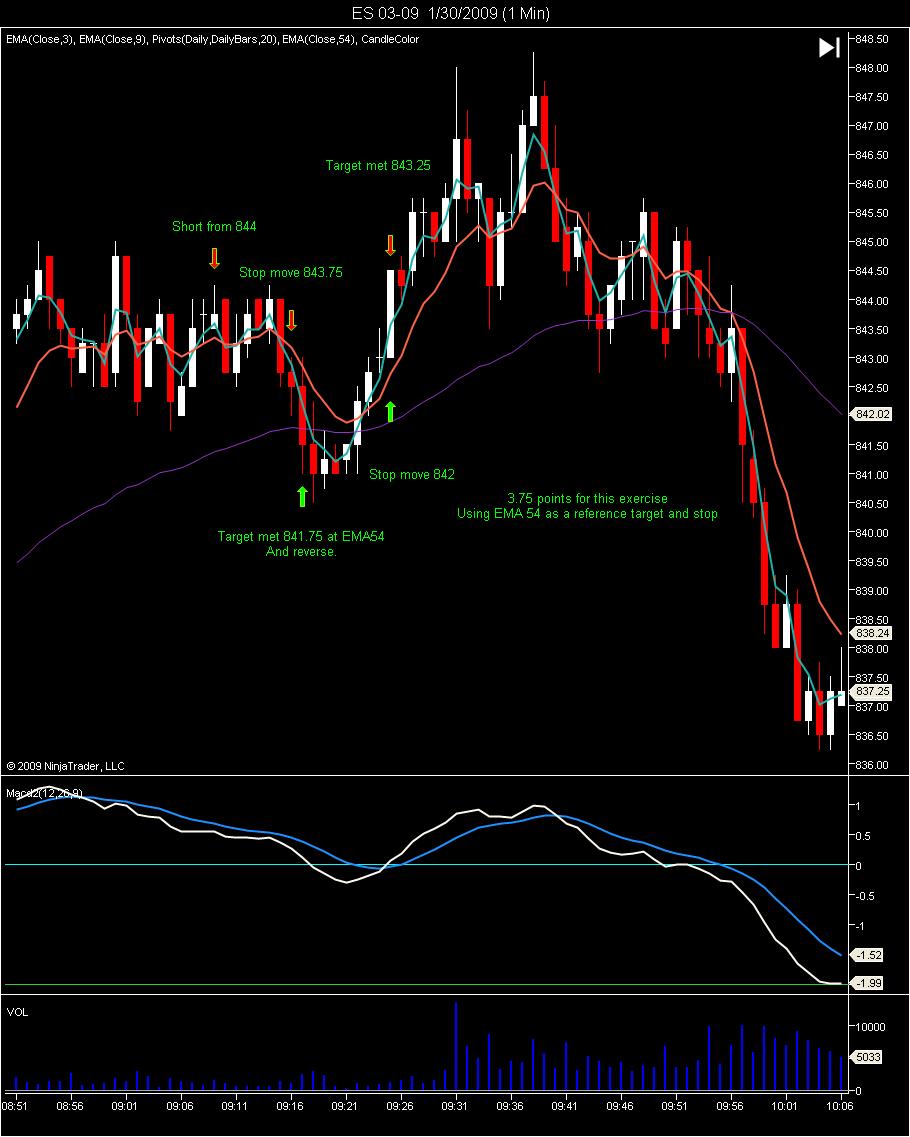
This is my contribution. My best trade of the week. Well only traded 1 day on Friday.
This is a reversal trade. Works better when there is an oscillation happening in a channel.
Used with the EMA54 indicator as a target, stop and reversal.
Move your stops to protect your gain. This is a risky move but rewards well in scalping in an oscillating trend (up or down). The best I have done was 3 times. Up, Down and Up.
I wouldn't advise to use this if the oscillation as been happening for 15 mins. A breakout is likely to occur.
It is a shame I did not keep to my 844 target on my reversal up. The market is definitely going down, just don't want to risk the gain.
Lord congrats on a successful trade(s)...what triggered your initial short down to the 54ema? Seems like the 3ema crossed up above the 9ema on your candle with red arrow above it. Taking profits to soon...yeah we all fight that.
great stuff, L.A.!
VO the initial short was a from the Red candle. Sorry. Wrong label. It was a bearish engulf. I would not be able to get the 44.25, so I opted lower 44 with a 1 pt stop behind.
This is for Durandal.
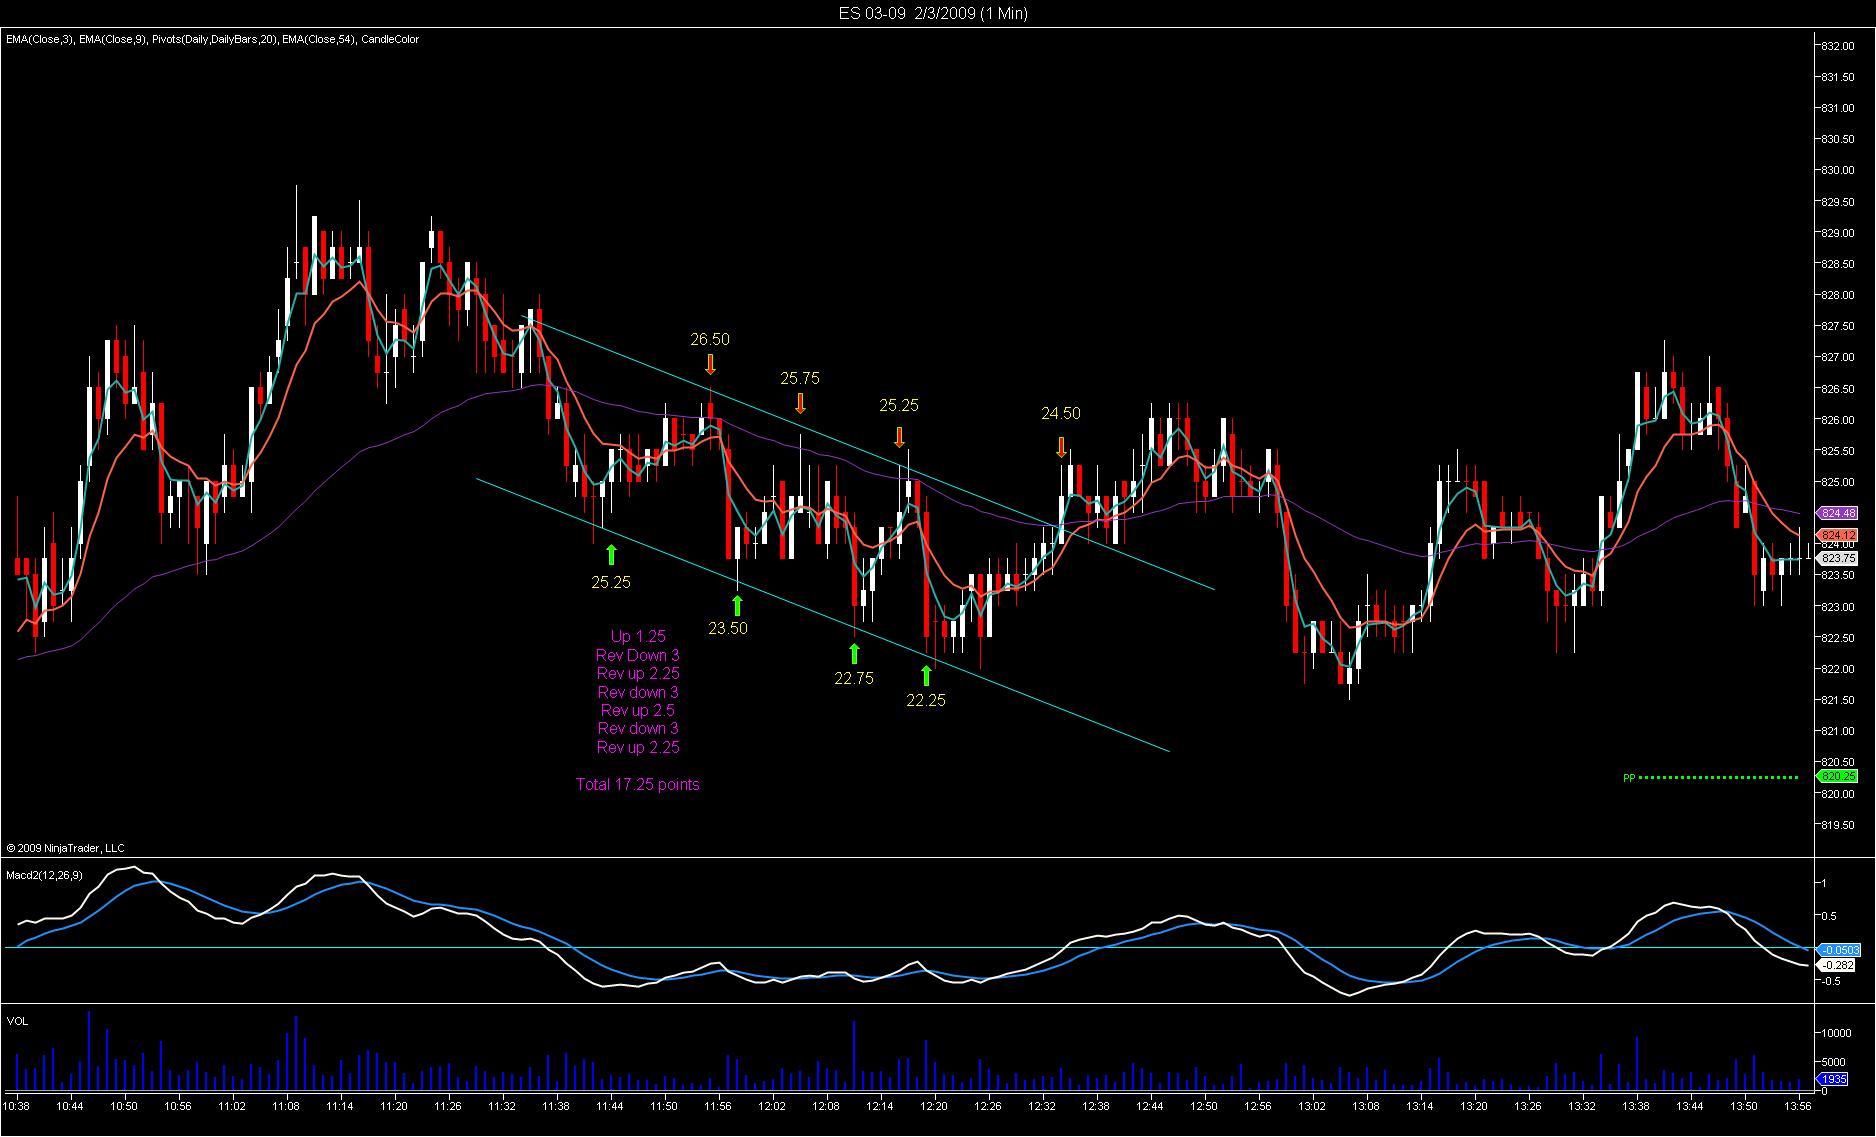
This would be a perfect trade setup. I did not reverse with this, I only shorted twice and got a cup of coffee to wake up.
1. Draw a straight trend line for the resistance. Extend it beyond the time range
2. Copy that trend line and do not alter it. Place it as the support target.
3. Go long for the 2nd bullish candle. Your entry will not be as good.
4. Set the target 1 tick above ema 54. You might have to move it for some movement of the the average. Set your reversal upon meeting the target.
5. Set 1 point stops to reduce risk, because this reversal thing is risky. If you reverse 1 tick above ema 54, your stops need not be wide.
6. As for the target below ema 54, also place 1 pt stops to protect against an all out breakout downwards. Target exactly at the suppoprt line, because unlike the ema 54, you must reverse in order to continue , else if you don't get filled, you can't work this out.
7. This is like driving through a slalom, you miss one cone and you have crashed the slalom test.
you certainly caught a nice channel to trade...great job!
Durandal,
I was messing around Ninja and doing some research. To see if some Ninja indicators could draw channels automatically.
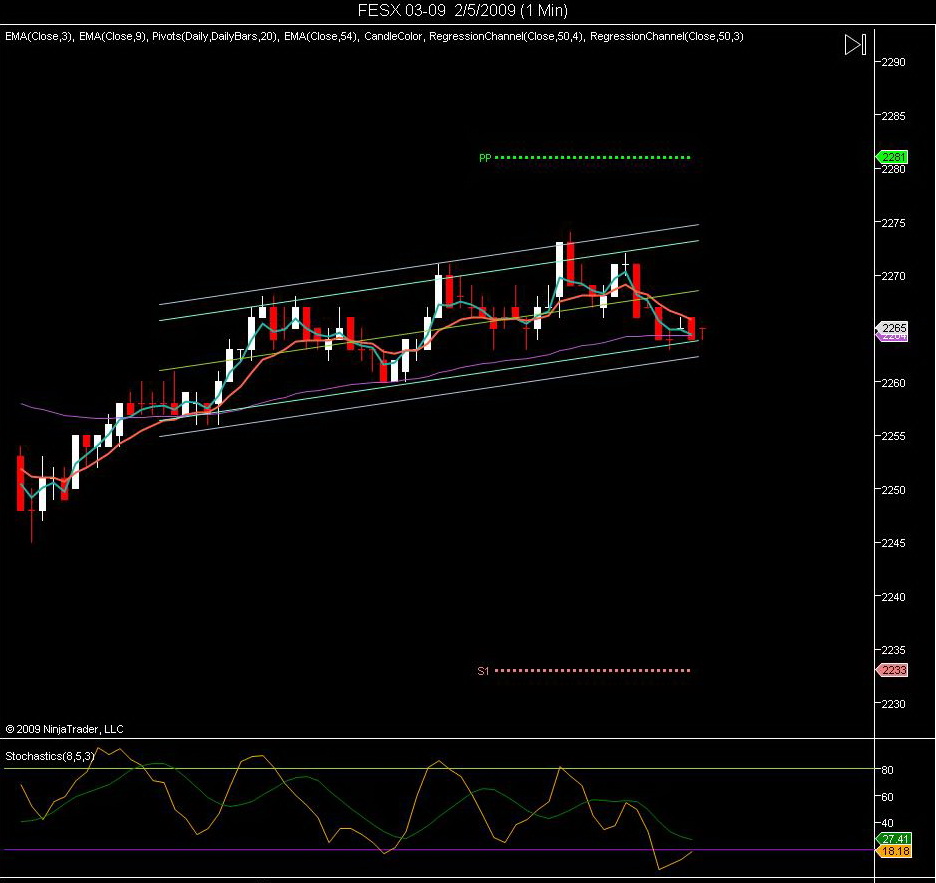
I have found the regression channel indicator.
It was recommended on ES using the 5 min chart at Period 90, width 2 and 1.5. And Period 50 for the 1 min chart at 2 and 1.5.
Both use Slow Stochastics 8, 5, 3 as complimenting indicators.
Since the volume is not that great at ES out of regular hours, I tested it on FESX.
The settings for the FESX on the 1 min by trial and error is different since there are no quarters on FESX, I widened the deviations by a factor of 2. So used Period 50, width 4 and with 3.
At 1.5 and 2, the risk reward ratio wasn't good. ES came out ok.
This is what I got.
According to the use.
Short when the high hits the upper band with Schocastics K penetrates tthe upper limit.
Long when the low hits the lower band with Schocastics K penetrates the lower limit.
Safer method is to short when it slopes downwards, long when it slopes upwards.
Profits can be taken at Median line or the Lower Band at higher risk. Be prepared to move the target should the slope changes direction.
Reversals at the bands can be made. This should be stronger when Stochastics is penetrated. I also found that the MACD Histogram that PT uses aids in the decision. Don't go short when the MACD signals buy even though the Stochastic K penetrates the upper limit.
Please backtest before using on LIVE.
Emini Day Trading /
Daily Notes /
Forecast /
Economic Events /
Search /
Terms and Conditions /
Disclaimer /
Books /
Online Books /
Site Map /
Contact /
Privacy Policy /
Links /
About /
Day Trading Forum /
Investment Calculators /
Pivot Point Calculator /
Market Profile Generator /
Fibonacci Calculator /
Mailing List /
Advertise Here /
Articles /
Financial Terms /
Brokers /
Software /
Holidays /
Stock Split Calendar /
Mortgage Calculator /
Donate
Copyright © 2004-2023, MyPivots. All rights reserved.
Copyright © 2004-2023, MyPivots. All rights reserved.


